3 March, 2020
Welcome!
Welcome to AmiBrokerAcademy.com. Thanks for visiting the site.
Our Believe
Give a Man a Fish, and You Feed Him for a Day. Teach a Man To Fish, and You Feed Him for a Lifetime – Lao-Tzu?
So, do not come here for fish. Only come here to learn how to fish. Have fun!
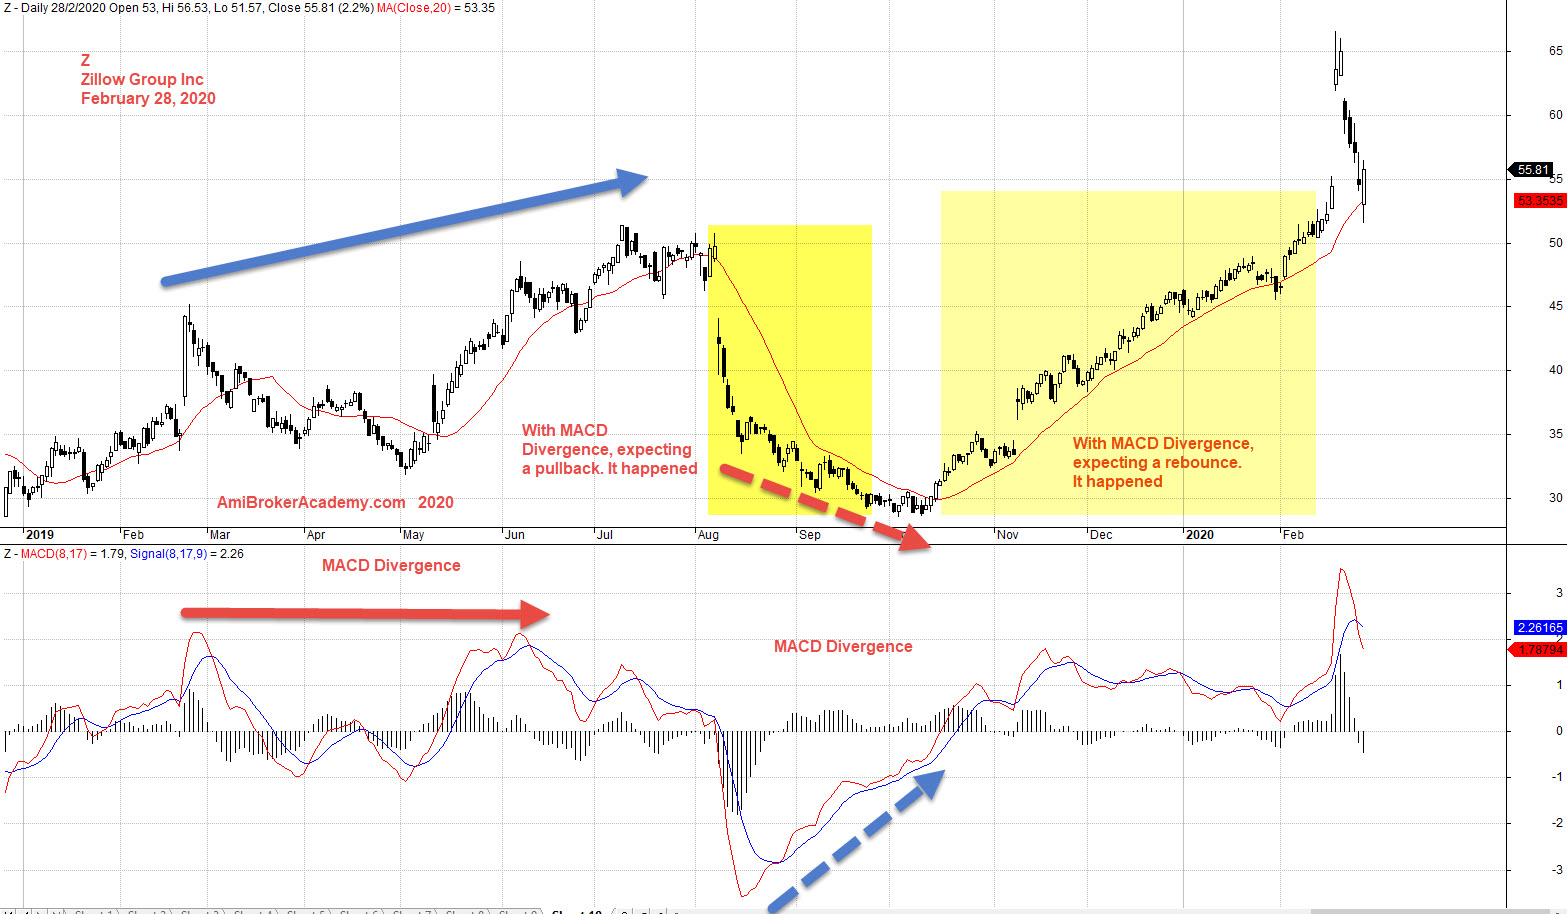
Z Zillow Group Inc Charting
Study Zillow Group Inc stock chart price and MACD Divergence.
See chart, picture worth a thousand words.
Manage your expectation.
Remember to trade what you see and not what you think.
If you are the site follower, without the explanation. You should see both the MACD divergence. One signal you the price is topping, Another one, signal you the price action is bottoming.
But, all setup can fail. So, manage your risk.
Moses Stock Observation
AmiBrokerAcademy.com
Disclaimer
The above result is for illustration purpose. It is not meant to be used for buy or sell decision. We do not recommend any particular stocks. If particular stocks of such are mentioned, they are meant as demonstration of Amibroker as a powerful charting software and MACD. Amibroker can program to scan the stocks for buy and sell signals.
These are script generated signals. Not all scan results are shown here. The MACD signal should use with price action. Users must understand what MACD and price action are all about before using them. If necessary you should attend a course to learn more on Technical Analysis (TA) and Moving Average Convergence Divergence, MACD.
Once again, the website does not guarantee any results or investment return based on the information and instruction you have read here. It should be used as learning aids only and if you decide to trade real money, all trading decision should be your own.