21 September, 2019
Welcome to AmiBrokerAcademy.com. Thanks for visiting the site.
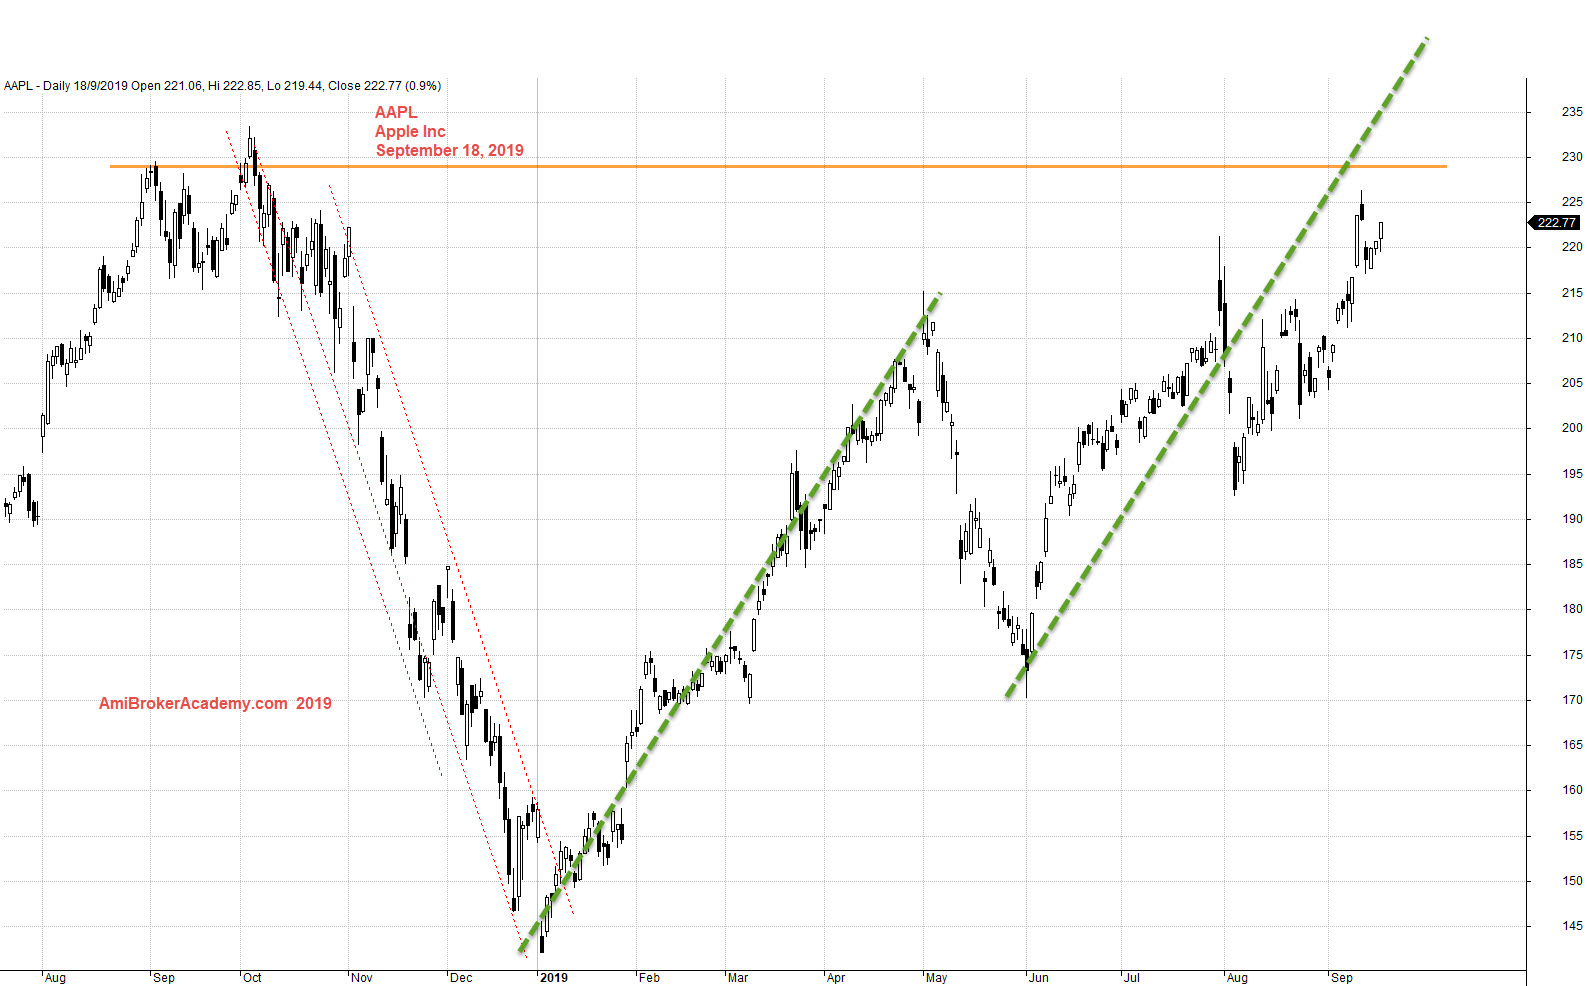
AAPL Apple Inc Stock Charting
Study Apple Inc stock chart and price action.
Look left and think right. It’s depending your expectation.
See chart, picture worth a thousand words.
Are you going to add more stock to your portfolio for Apple stock? Be aware, the price action is near the last resistance. You might be okay, as the iPhone 11 is just launch. But if the take up rate is below analysts expectation. You know what will happen to the stock price.
From H M Gartley AB=CD pattern, there are still room for CD leg. But you know all setup can fail. Is just the new launch may not drive the consumer as plan.
Trade with your eyes open.

Some say, “iPhone 11 may be a lot more popular than anyone expected”, true or true? Will see.
Moses Stock Observation
AmiBrokerAcademy.com
Disclaimer
The above result is for illustration purpose. It is not meant to be used for buy or sell decision. We do not recommend any particular stocks. If particular stocks of such are mentioned, they are meant as demonstration of Amibroker as a powerful charting software and MACD. Amibroker can program to scan the stocks for buy and sell signals.
These are script generated signals. Not all scan results are shown here. The MACD signal should use with price action. Users must understand what MACD and price action are all about before using them. If necessary you should attend a course to learn more on Technical Analysis (TA) and Moving Average Convergence Divergence, MACD.
Once again, the website does not guarantee any results or investment return based on the information and instruction you have read here. It should be used as learning aids only and if you decide to trade real money, all trading decision should be your own.