September 24, 2017
^NDX NASDAQ-100 Index and 34 MA Band
MA is slopping from bottom left to top right, uptrend. Price action cross above MA and stay above MA. Moving Average is a great visual tool for trend.
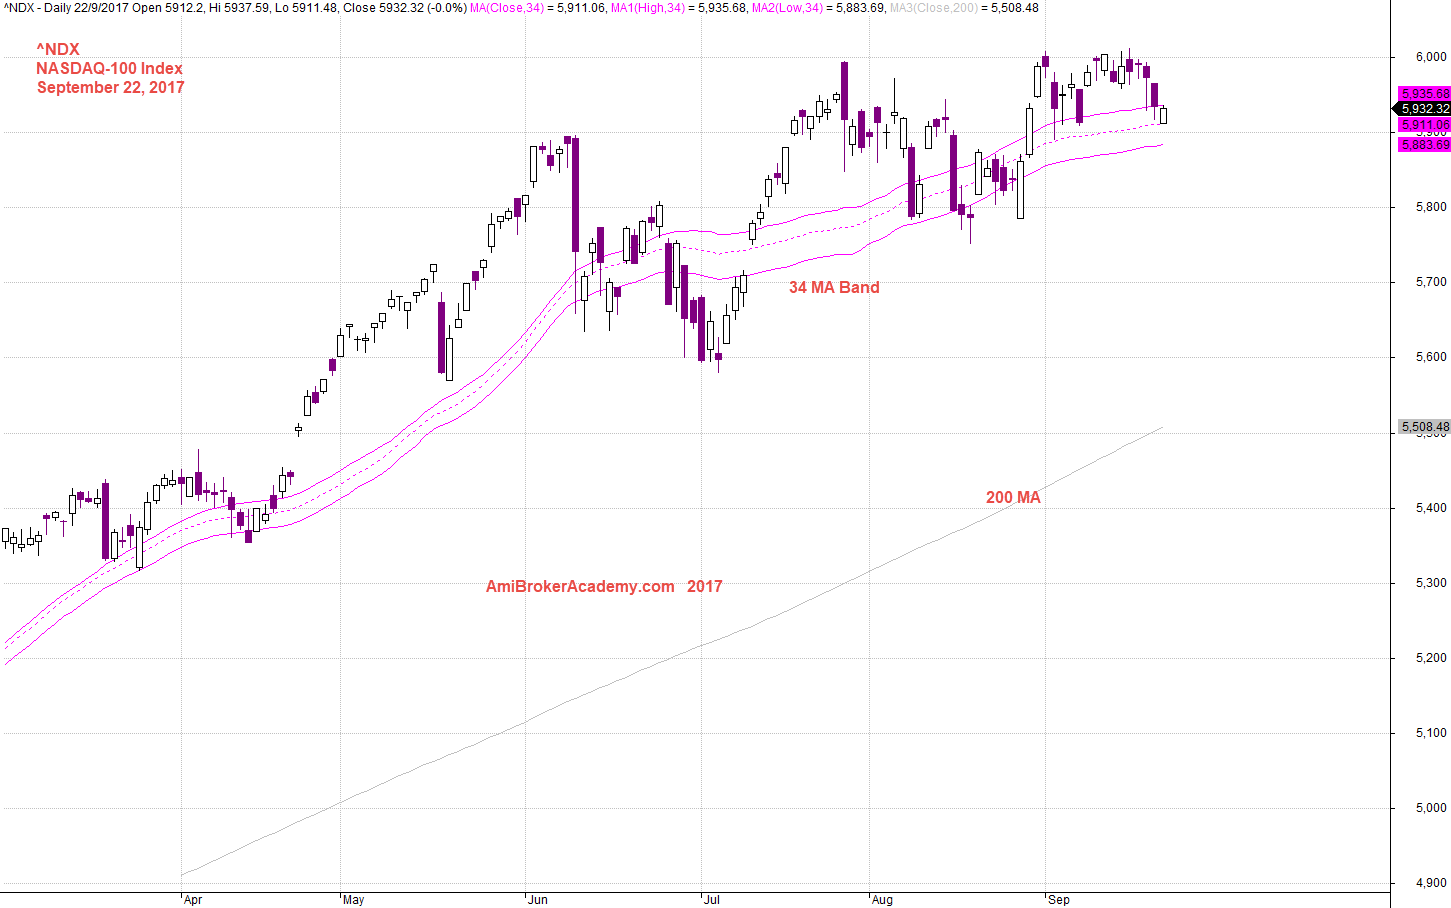
September 22, 2017 NASDAQ-100 and 34 MA Band
^NDX NASDAQ-100 Index and Channels
Channel slopping from bottom left to top right, bullish trend.
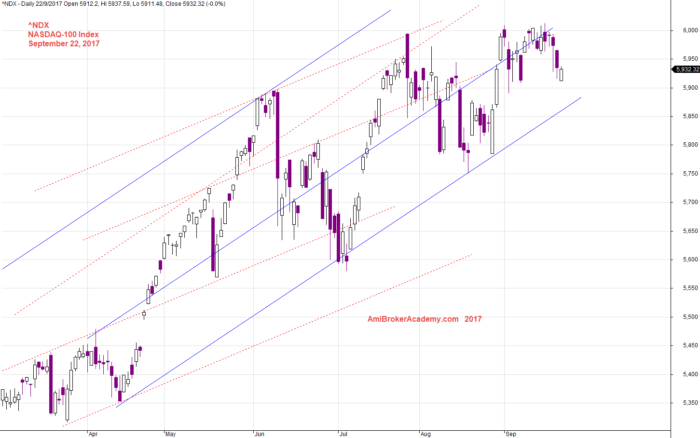
September 22 2017, NASDAQ-100 Index and Channels
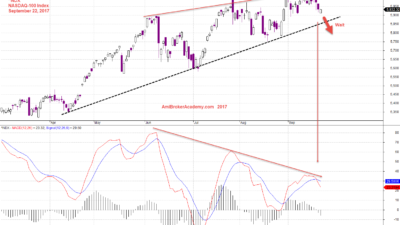
September 22, 2017 NASDAQ-100 and MACD Divergence
^NDX NASDAQ-100 Index and MACD Divergence
Picture worth a thousands words, see chart for more. ^NDX forms higher high, MACD signal forms lower high; divergence. Trend ending? Will see.
Wait for trendline breakout, confirmation.
Moses
AmiBrokerAcademy.com
Disclaimer
The above result is for illustration purpose. It is not meant to be used for buy or sell decision. We do not recommend any particular stocks. If particular stocks of such are mentioned, they are meant as demonstration of Amibroker as a powerful charting software and MACD. Amibroker can program to scan the stocks for buy and sell signals.
These are script generated signals. Not all scan results are shown here. The MACD signal should use with price action. Users must understand what MACD and price action are all about before using them. If necessary you should attend a course to learn more on Technical Analysis (TA) and Moving Average Convergence Divergence, MACD.
Once again, the website does not guarantee any results or investment return based on the information and instruction you have read here. It should be used as learning aids only and if you decide to trade real money, all trading decision should be your own.