11 June 2021
Welcome!
Welcome to AmiBroker Academy dot com, amibrokeracademy.com.
BTC-USD | Bitcoin Crypto and Bollinger Bands and Moving Averages
Study Bitcoin Crypto and Bollinger Bands and Moving Averages.
Remember, Gold bar can use as paper weight but not your Cryptocurrency. Besides that unless there is good and responsible infrastructure, otherwise when Global infra crashes, you smell nothing. This is great about the digitization. Keep a record of what you have and all transactions.
We study BTC six days back, this is an update. Bollinger bands has clearly hints there were less interest in the market in the last four five days. Read and digest the price action.
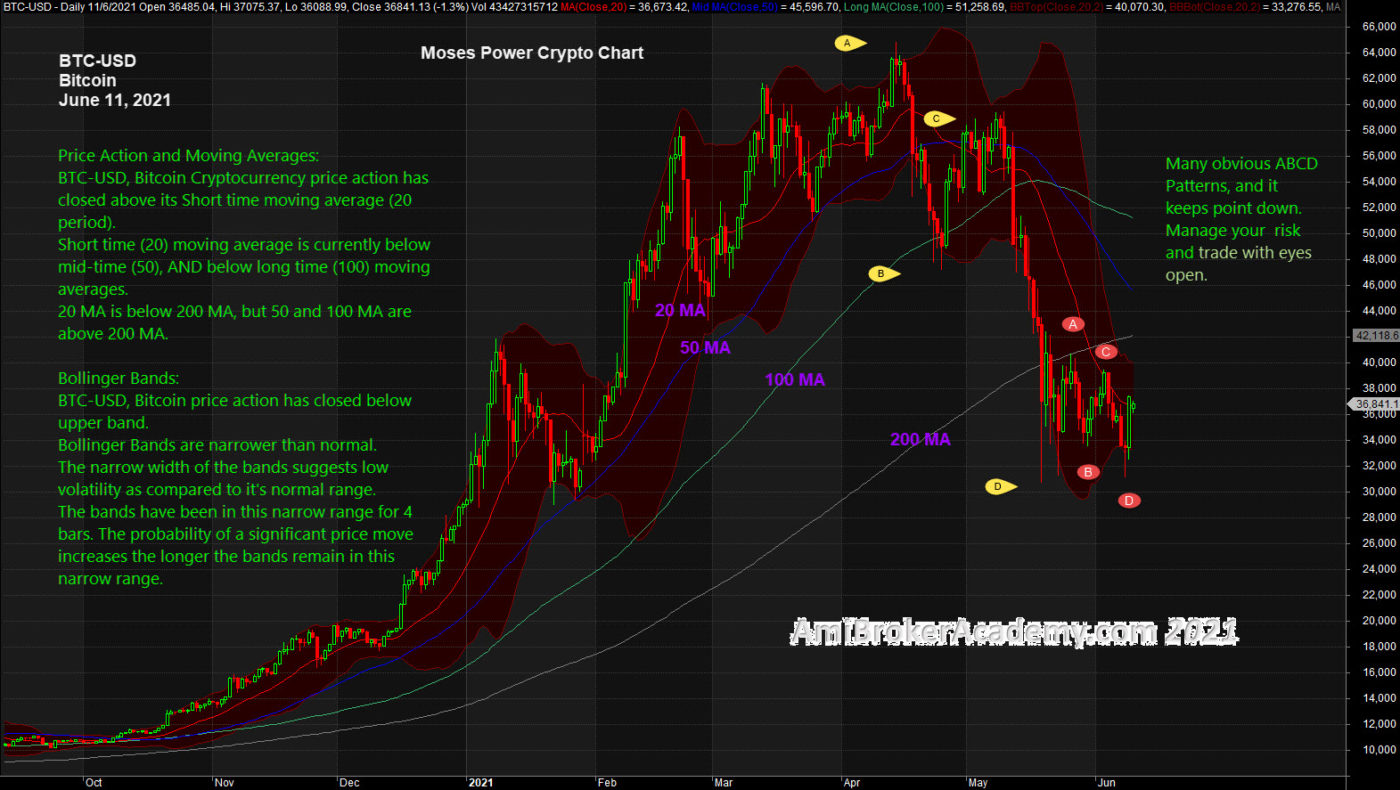
Price Action and Moving Averages:
BTC-USD, Bitcoin Cryptocurrency price action has closed above its Short time moving average (20 period).
Short time (20) moving average is currently below mid-time (50), AND below long time (100) moving averages.
20 MA is below 200 MA, but 50 and 100 MA are above 200 MA.
See chart, Bollinger Bands:
BTC-USD, Bitcoin price action has closed below upper band.
Bollinger Bands are narrower than normal.
The narrow width of the bands suggests low volatility as compared to it’s normal range.
The bands have been in this narrow range for 4 bars. The probability of a significant price move increases the longer the bands remain in this narrow range.
Manage risk is a key in trading. Trade carefully.
Moses Free Crypto Power Charting
Moses Power Crypto Charting
Official AmiBrokerAcademy.com Charting
Disclaimer
The above result is for illustration purpose. It is not meant to be used for buy or sell decision. We do not recommend any particular stocks. If particular stocks of such are mentioned, they are meant as demonstration of Amibroker as a powerful charting software and MACD. Amibroker can program to scan the stocks for buy and sell signals.
These are script generated signals. Not all scan results are shown here. The MACD signal should use with price action. Users must understand what MACD and price action are all about before using them. If necessary you should attend a course to learn more on Technical Analysis (TA) and Moving Average Convergence Divergence, MACD.
Once again, the website does not guarantee any results or investment return based on the information and instruction you have read here. It should be used as learning aids only and if you decide to trade real money, all trading decision should be your own.
We learn from many past and present great traders. Kudo to these master.