June 13, 2019
Welcome!
Welcome to AmiBrokerAcademy.com. Thanks for visiting the site.
Have fun!
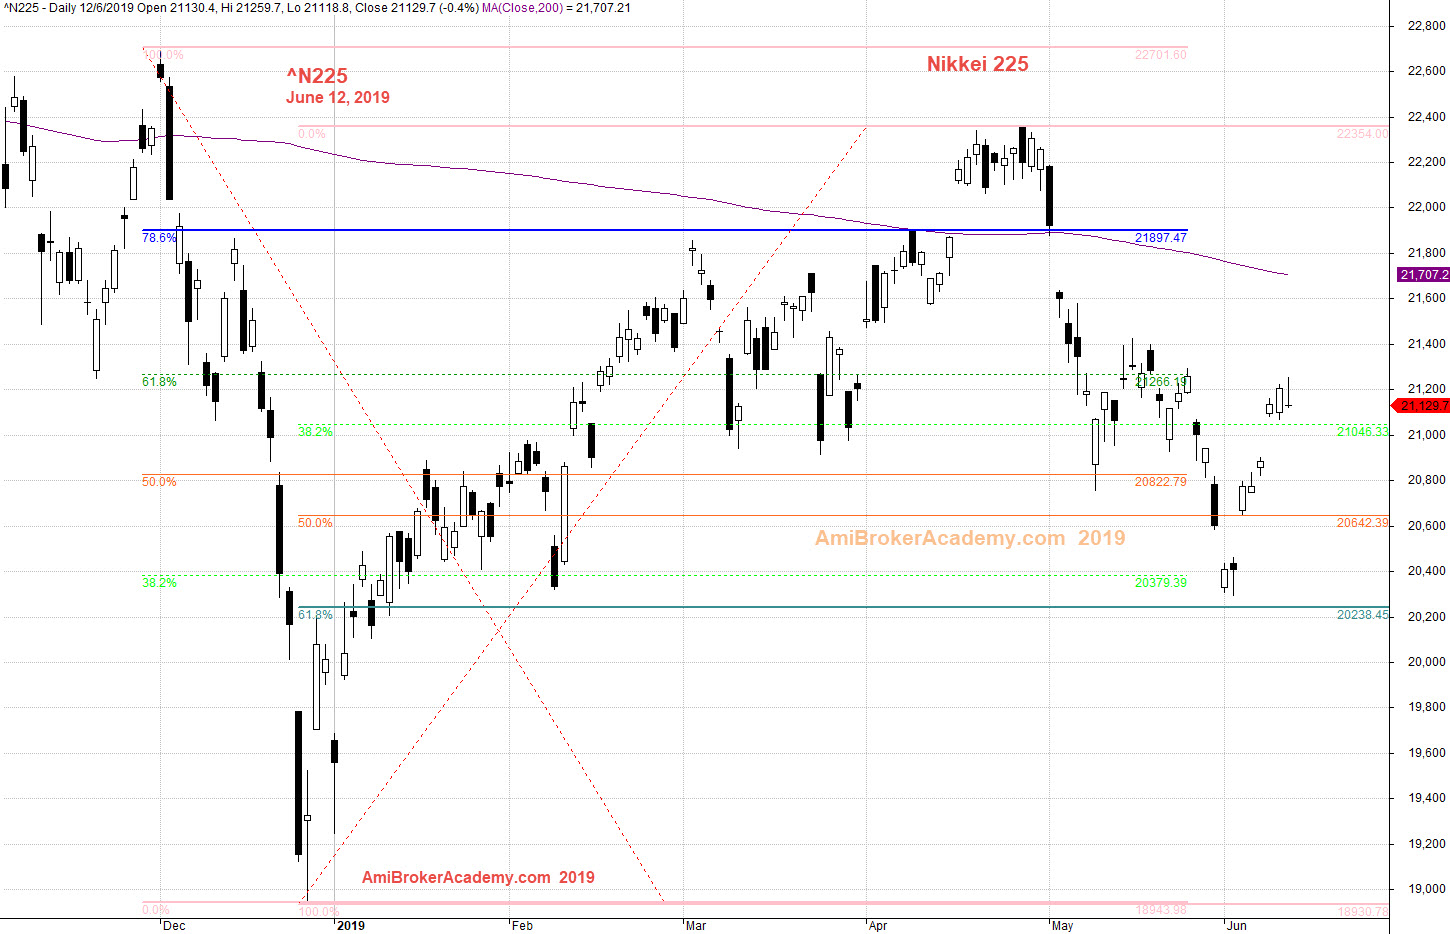
^N225 Nikkei Index 225日经指数 225 Index Stock Charting
Last analysis was at May 10. Let’s study Nikkei 225 Index 日经指数 225 stock chart and Fibonacci again.
日经指数, 日本东京证交所编制的股价指数, 是投资人研究日本股市的一个重要参考指数。日经指数有不同系列, 最为人熟知的是 Nikkei 225
See chart, picture worth a thousand words.
Fibo swing high to low, to find resistance. And Fibonacci swing low to high to find support.
Price action was resisted above 78%, and decline. And price action was supported near 61%, near 20,200 level.
Trade with your eyes open.
Moses Stock Observation
AmiBrokerAcademy.com
Disclaimer
The above result is for illustration purpose. It is not meant to be used for buy or sell decision. We do not recommend any particular stocks. If particular stocks of such are mentioned, they are meant as demonstration of Amibroker as a powerful charting software and MACD. Amibroker can program to scan the stocks for buy and sell signals.
These are script generated signals. Not all scan results are shown here. The MACD signal should use with price action. Users must understand what MACD and price action are all about before using them. If necessary you should attend a course to learn more on Technical Analysis (TA) and Moving Average Convergence Divergence, MACD.
Once again, the website does not guarantee any results or investment return based on the information and instruction you have read here. It should be used as learning aids only and if you decide to trade real money, all trading decision should be your own.