1 August 2021
Welcome!
Welcome to AmiBroker Academy dot com, amibrokeracademy.com.
Secret Code
The analysis is not for everyone.
This is not a site for those whom just want to find buy or sell signal. Because we don’t provide you any buy or sell information, we only provide you the thought you can decide and take responsibility.
Trading is all about observation, reading the price bar and not news. By the time you hear the news it is already old and become history. Why? It is very simple, remember where the news come from? It has first someone release to the news agency like CNBC, and so on. Next, someone has to read the news to you after some research and summarize. This will be few hours later, by then the price action has already done.
As for price bar, it is what the market supply and remand. When market feel that is over price, the price will drop. All this reflected on the price bar almost instantly.
Next is how to read our price bar plus using some tools, such as MACD.
Here, we simply translate price action chart into layman language. This will help you in understand the financial instrument you are trading. We believe picture worth a thousand words. So, sometimes we use less words. You can learn the price action interpretation too. Give it a tray. You may not have the same view points as us. Remember all analysis read price action chart differently. It is just like reading an essay, we will have different conclusion.
Trade well.
Trade what you see. Manage your risk.
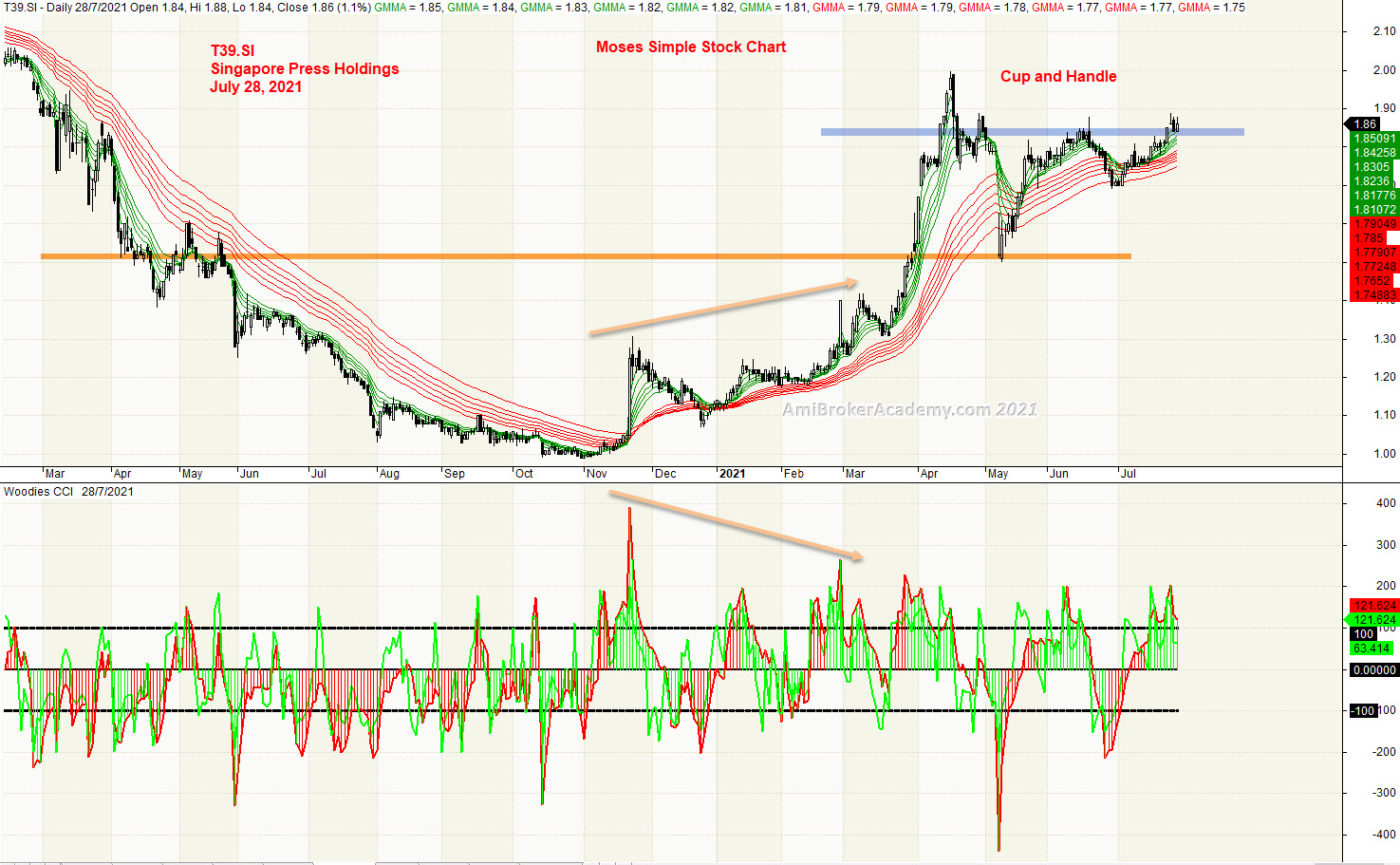
1) Singapore Press Holdings and GMMA and Woodies CCI
Price Action goes from top to bottom and top again. If you stand further, you can not miss the cup and handle pattern. From another view, it is a bullish pattern. Trade with care.
Moving Average is a great visual tool. Daryl Guppy, an Australian financial columnist developed a trading tactics using moving average. The aims is to aniticipate a potential breakout.
When both Fast (green) and Slow (red) MA squeeze and come together, look out for a price action change.
Overall, the price action shows a cup and handle chart pattern.
Manage your risk.
Moses Power Charting
Official AmiBrokerAcademy.com Charting
Disclaimer
The above result is for illustration purpose. It is not meant to be used for buy or sell decision. We do not recommend any particular stocks. If particular stocks of such are mentioned, they are meant as demonstration of Amibroker as a powerful charting software and MACD. Amibroker can program to scan the stocks for buy and sell signals.
These are script generated signals. Not all scan results are shown here. The MACD signal should use with price action. Users must understand what MACD and price action are all about before using them. If necessary you should attend a course to learn more on Technical Analysis (TA) and Moving Average Convergence Divergence, MACD.
Once again, the website does not guarantee any results or investment return based on the information and instruction you have read here. It should be used as learning aids only and if you decide to trade real money, all trading decision should be your own.
We learn from many past and present great traders. Kudo to these master.