July 22, 2014
Moses’s US and Singapore Stock Analysis – Singapore Stock ComfortDelgro, C52 July21, 2014
Welcome to Moses’s Stock Corner at AmiBrokerAcademy.com. Thought and Notes on Trading. Thank you for visiting the site. One of the reasons you are here because you want to know why the stock moves or which stocks will move in the near future.
I have analysed Singapore transportation stocks previously.
This is July 21, 2014 ComfortDelGro Corporation, C52 share price action ended touching Bollinger Bands (20, 2) at 2.58. Is it top? In order for the price action to go further up, the price action has to come down first.
Look left, C52 has started swing low to swing high since May 7, 2014 from 2 dollars till now closed last night at 2 dollars 58 cents. Although price action has closed above the opening price, it left a long shadow. What is the price action try to tell you?
Technical Analysis
Technical Analysts use price action charts to interpret what is the most likely movement for the next move or moves. Bollinger Bands is a great tool to know the volatility and emotions of the market. When the price action closed outside of the band, signify the strength of the price action. The price action will continue the trend. However, when the price action start to close inside the band, the price action is weaken. The trend may be reversal.
Bollinger Bands is like a rubber band. It keeps the price action within the rubber band. The rubber band stretch when the market is volatile. After the rubber band stretch, next the rubber band will shrink, will contract. The price action is less volatile is more calm.
Indicator such as Bollinger Bands is like thunder and lightning. It warns what’s coming, that might be raining. But you need to see raindrops (price action) to confirm that it is raining.
Wait for confirmation, such as price action formed low high. Have fun!
You can read past posting on Singapore ComfortDelGro, C52. Click the link here!
ComfortDelGro Corporation Ltd, C52 Daily Chart closed July 21, 2014
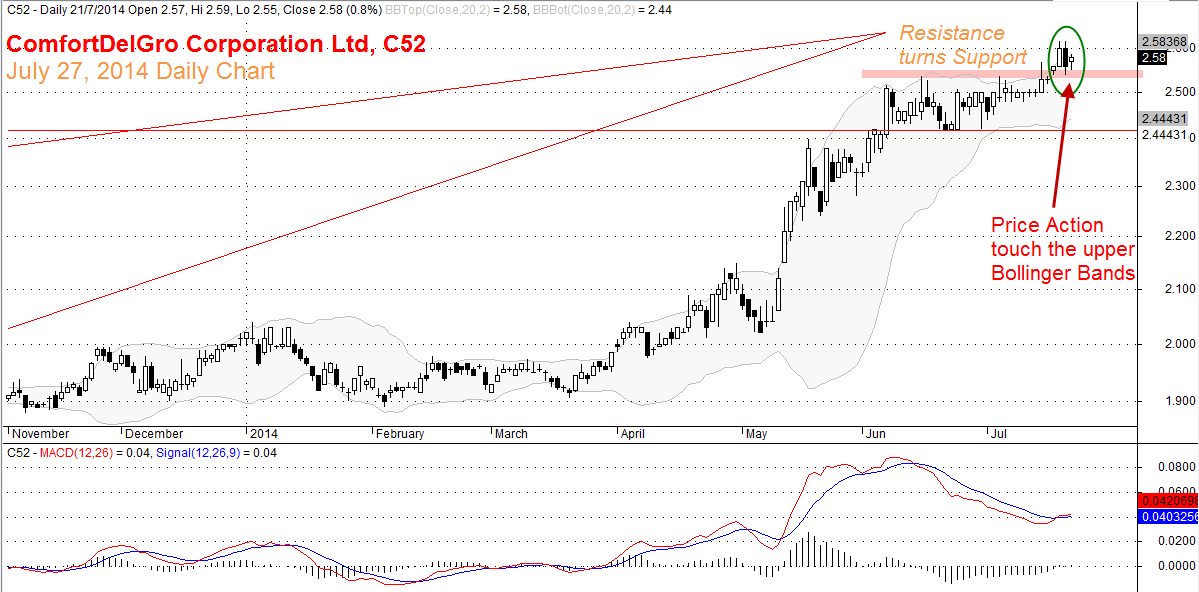
ComfortDelGro Corporation Limited, C52 July 21, 2014 Daily Chart
Ten Years Weekly Chart, ComfortDelGro Corporation Limited
Chart worth a thousand words!. What can you get from the ten years chart? See the Geometry Chart Pattern, AB = CD.
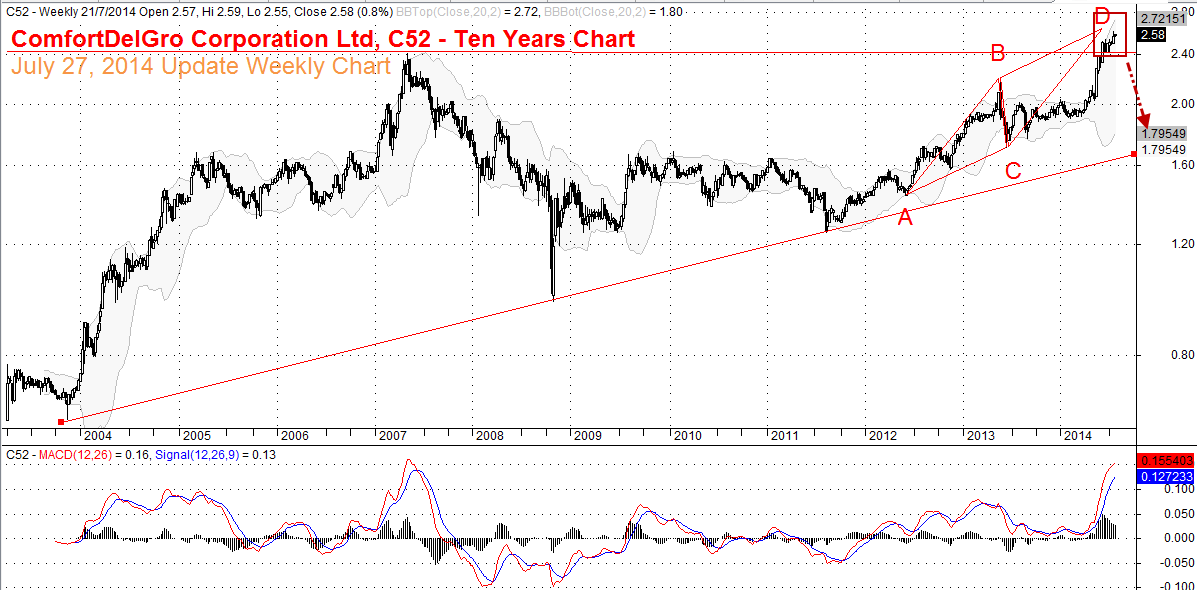
Ten Years Weekly Chart since 2004. ComfortDelGro Corporation Limited, C52 July 21, 2014
Moses
DISCLAIMER
Information provided here is of the nature of a general comment only and no intend to be specific for trading advice. It has prepared without regard to any particular investment objectives, financial situation or needs. Information should not be considered as an offer or enticement to buy, sell or trade.
You should seek advice from your broker, or licensed investment advisor, before taking any action.
Once again, the website does not guarantee any results or investment return based on the information and instruction you have read here. It should be used as learning aids only and if you decide to trade real money, all trading decision should be your own.