July 22, 2014
Moses’ US and Singapore Stock Analysis – Straits Times Index, STI
Welcome to Moses’s Stock Column at AmiBrokerAcademy.com. Thank you for visiting the site. One of the reasons you are here because you want to know why the stock moves or which stocks will move in the near future.
The site here provides Singapore stocks scan that has MACD bullish signal or bearish signal. This is July 21, 2014, the stock market benchmark, Straits Times Index, a window into Singapore economy. STI closed at 3314.27 points, Straits Times Index gaps up 3.74 points from last Friday closed at 3310.53 points. Bulls and Bears fight, and still undecided, Doji candlestick.
Straits Times Index
Forming the Right Shoulder (RS), wait for the RS to complete. Just like thunder and lightning. It warns what’s coming, that might be raining. But you need to see raindrops (index) to confirm that it is raining.
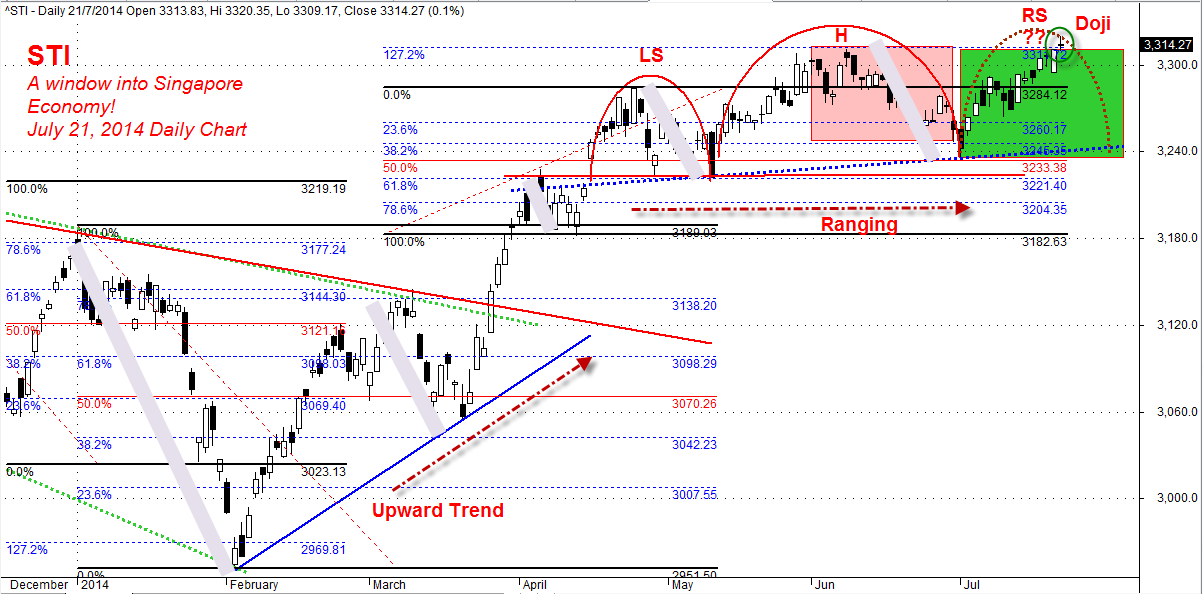
July 21, 2014 Straits Times Index, STI Daily Chart
Thanks for visiting the site, AmiBrokerAcademy.com. Please checkout earlier posting for other analysis.
Moses
DISCLAIMER
Information provided here is of the nature of a general comment only and no intend to be specific for trading advice. It has prepared without regard to any particular investment objectives, financial situation or needs. Information should not be considered as an offer or enticement to buy, sell or trade.
You should seek advice from your broker, or licensed investment advisor, before taking any action.
Once again, the website does not guarantee any results or investment return based on the information and instruction you have read here. It should be used as learning aids only and if you decide to trade real money, all trading decision should be your own.