Moses’s Singapore Stock Analysis – January 4, 2017 The Straits Times Index
Welcome to Moses’s Stock Scan at AmiBrokerAcademy.com. This is January 4, 2017, the economy benchmark, The Straits Times Index closed at 2921.31 points, another 22.34 points higher than the last closed. Can the momentum continue? Will see!
STI has breakout from 34 EMA Wave!
Technical Analysis
In total, the index is now 21.31 points higher than 2900. If we take 2900 as a key level.
Check the Straits Times Index daily chart for more.
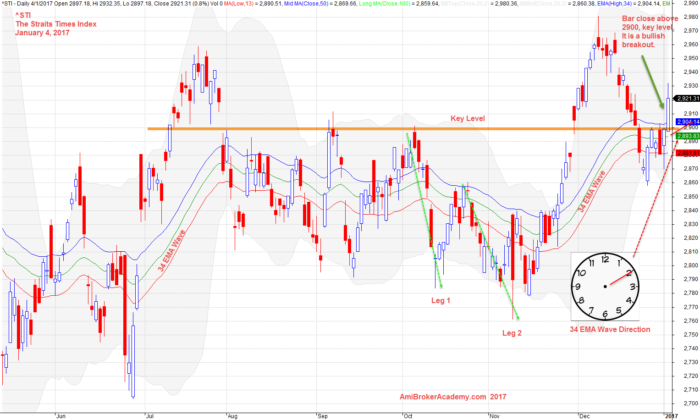
January 4, 2017 The Straits Times Index Daily and Two Legs
The analysis here is a hybrid, oh no it is more than two. We use indicators, we use price action, we use chart pattern, we use …. But one thing for sure be confident and have fun! Enjoy your reading here.
By Moses January 13, 2017
AmiBrokerAcademy.com
Disclaimer
The above result is for illustration purpose. It is not meant to be used for buy or sell decision. We do not recommend any particular stocks. If particular stocks of such are mentioned, they are meant as demonstration of Amibroker as a powerful charting software and MACD. Amibroker can program to scan the stocks for buy and sell signals.
These are script generated signals. Not all scan results are shown here. The MACD signal should use with price action. Users must understand what MACD and price action are all about before using them. If necessary you should attend a course to learn more on Technical Analysis (TA) and Moving Average Convergence Divergence, MACD.
Once again, the website does not guarantee any results or investment return based on the information and instruction you have read here. It should be used as learning aids only and if you decide to trade real money, all trading decision should be your own.