1 January, 2019
Happy New Year! What’s Your New Year Resolution for 2019?
My is “trade with eyes open and manage risk well”.
Thanks for visiting the site.
Free U.S. Stock Five-day MACD Scan
Wht is AmiBroker AFL?
See the following link https://www.amibroker.com/guide/AFL.html on AmiBroker AFL.
What is MACD?
MACD stands for Moving Average Convergence Divergence, common setting is (12,26,9)
MACD indicator is a trend trading system that makes up of 2 lines. The MACD Line (fast line) and MACD Signal Line (slow line).
1) When the MACD Line crosses over the MACD Signal Line the trend is bullish. When the MACD Line crosses below the MACD Signal the trend is bearish.
2) When the MACD Line crosses above zero line the trend is bullish. When the MACD line crosses below zero line the trend is bearish.
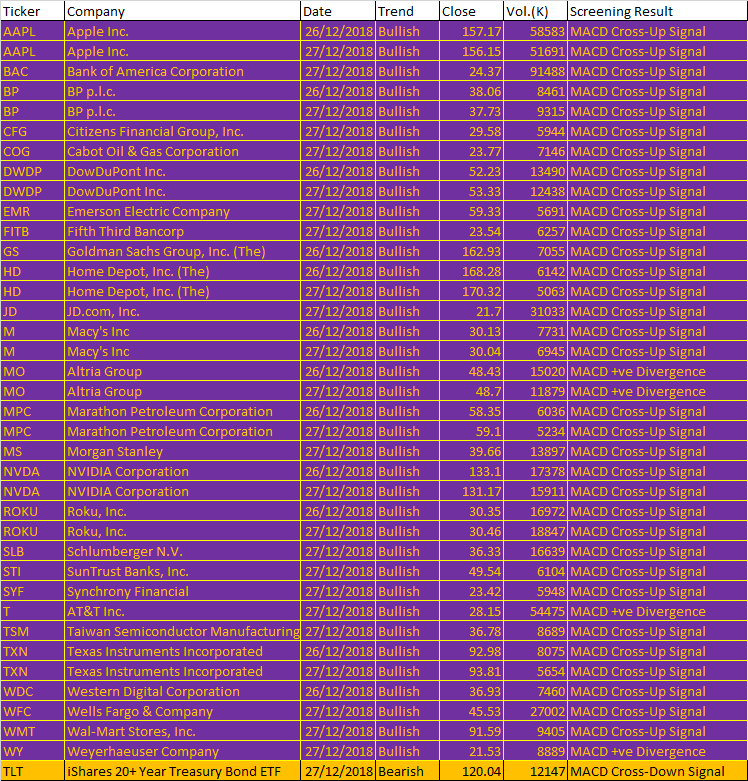
24 to 28 December 2018 AmiBroker AFL Script Generated Five-day U.S. Stock MACD Signals
The following are script generated Five-day U.S. Stock Market MACD signals using the Powerful AmiBroker’s AFL.
The MACD Setting used is (8,17,9)
| Ticker | Company | Date | Trend | Close | Vol.(K) | Screening Result |
| AAPL | Apple Inc. | 26/12/2018 | Bullish | 157.17 | 58583 | MACD Cross-Up Signal |
| AAPL | Apple Inc. | 27/12/2018 | Bullish | 156.15 | 51691 | MACD Cross-Up Signal |
| BAC | Bank of America Corporation | 27/12/2018 | Bullish | 24.37 | 91488 | MACD Cross-Up Signal |
| BP | BP p.l.c. | 26/12/2018 | Bullish | 38.06 | 8461 | MACD Cross-Up Signal |
| BP | BP p.l.c. | 27/12/2018 | Bullish | 37.73 | 9315 | MACD Cross-Up Signal |
| CFG | Citizens Financial Group, Inc. | 27/12/2018 | Bullish | 29.58 | 5944 | MACD Cross-Up Signal |
| COG | Cabot Oil & Gas Corporation | 27/12/2018 | Bullish | 23.77 | 7146 | MACD Cross-Up Signal |
| DWDP | DowDuPont Inc. | 26/12/2018 | Bullish | 52.23 | 13490 | MACD Cross-Up Signal |
| DWDP | DowDuPont Inc. | 27/12/2018 | Bullish | 53.33 | 12438 | MACD Cross-Up Signal |
| EMR | Emerson Electric Company | 27/12/2018 | Bullish | 59.33 | 5691 | MACD Cross-Up Signal |
| FITB | Fifth Third Bancorp | 27/12/2018 | Bullish | 23.54 | 6257 | MACD Cross-Up Signal |
| GS | Goldman Sachs Group, Inc. (The) | 26/12/2018 | Bullish | 162.93 | 7055 | MACD Cross-Up Signal |
| HD | Home Depot, Inc. (The) | 26/12/2018 | Bullish | 168.28 | 6142 | MACD Cross-Up Signal |
| HD | Home Depot, Inc. (The) | 27/12/2018 | Bullish | 170.32 | 5063 | MACD Cross-Up Signal |
| JD | JD.com, Inc. | 27/12/2018 | Bullish | 21.7 | 31033 | MACD Cross-Up Signal |
| M | Macy’s Inc | 26/12/2018 | Bullish | 30.13 | 7731 | MACD Cross-Up Signal |
| M | Macy’s Inc | 27/12/2018 | Bullish | 30.04 | 6945 | MACD Cross-Up Signal |
| MO | Altria Group | 26/12/2018 | Bullish | 48.43 | 15020 | MACD +ve Divergence |
| MO | Altria Group | 27/12/2018 | Bullish | 48.7 | 11879 | MACD +ve Divergence |
| MPC | Marathon Petroleum Corporation | 26/12/2018 | Bullish | 58.35 | 6036 | MACD Cross-Up Signal |
| MPC | Marathon Petroleum Corporation | 27/12/2018 | Bullish | 59.1 | 5234 | MACD Cross-Up Signal |
| MS | Morgan Stanley | 27/12/2018 | Bullish | 39.66 | 13897 | MACD Cross-Up Signal |
| NVDA | NVIDIA Corporation | 26/12/2018 | Bullish | 133.1 | 17378 | MACD Cross-Up Signal |
| NVDA | NVIDIA Corporation | 27/12/2018 | Bullish | 131.17 | 15911 | MACD Cross-Up Signal |
| ROKU | Roku, Inc. | 26/12/2018 | Bullish | 30.35 | 16972 | MACD Cross-Up Signal |
| ROKU | Roku, Inc. | 27/12/2018 | Bullish | 30.46 | 18847 | MACD Cross-Up Signal |
| SLB | Schlumberger N.V. | 27/12/2018 | Bullish | 36.33 | 16639 | MACD Cross-Up Signal |
| STI | SunTrust Banks, Inc. | 27/12/2018 | Bullish | 49.54 | 6104 | MACD Cross-Up Signal |
| SYF | Synchrony Financial | 27/12/2018 | Bullish | 23.42 | 5948 | MACD Cross-Up Signal |
| T | AT&T Inc. | 27/12/2018 | Bullish | 28.15 | 54475 | MACD +ve Divergence |
| TSM | Taiwan Semiconductor Manufacturing Company Ltd. | 27/12/2018 | Bullish | 36.78 | 8689 | MACD Cross-Up Signal |
| TXN | Texas Instruments Incorporated | 26/12/2018 | Bullish | 92.98 | 8075 | MACD Cross-Up Signal |
| TXN | Texas Instruments Incorporated | 27/12/2018 | Bullish | 93.81 | 5654 | MACD Cross-Up Signal |
| WDC | Western Digital Corporation | 26/12/2018 | Bullish | 36.93 | 7460 | MACD Cross-Up Signal |
| WFC | Wells Fargo & Company | 27/12/2018 | Bullish | 45.53 | 27002 | MACD Cross-Up Signal |
| WMT | Wal-Mart Stores, Inc. | 27/12/2018 | Bullish | 91.59 | 9405 | MACD Cross-Up Signal |
| WY | Weyerhaeuser Company | 27/12/2018 | Bullish | 21.53 | 8889 | MACD +ve Divergence |
| TLT | iShares 20+ Year Treasury Bond ETF | 27/12/2018 | Bearish | 120.04 | 12147 | MACD Cross-Down Signal |
Moses U.S. Stock MACD Scan
AmiBroker Academy.com
Disclaimer
The above result is for illustration purpose. It is not meant to be used for buy or sell decision. We do not recommend any particular stocks. If particular stocks of such are mentioned, they are meant as demonstration of Amibroker as a powerful charting software and MACD. Amibroker can program to scan the stocks for buy and sell signals.
These are script generated signals. Not all scan results are shown here. The MACD signal should use with price action. Users must understand what MACD and price action are all about before using them. If necessary you should attend a course to learn more on Technical Analysis (TA) and Moving Average Convergence Divergence, MACD.
Once again, the website does not guarantee any results or investment return based on the information and instruction you have read here. It should be used as learning aids only and if you decide to trade real money, all trading decision should be your own.