16 June, 2018
Thanks for visiting the site.
U.S. Stock Chart Analysis
VVI Viad Corporation Charting and Support Resistance
Picture worth a thousand words, see chart on Viad Corporation stock price action. Manage your risk. We see the price action test near 62, and again and again, and follow a zigzag fall. The fall finally stop slightly below 50. The price bounce up again. Do you know why? Look at the chart carefully, you will find the level 50 is a formal resistance before and was supported also, see chart.
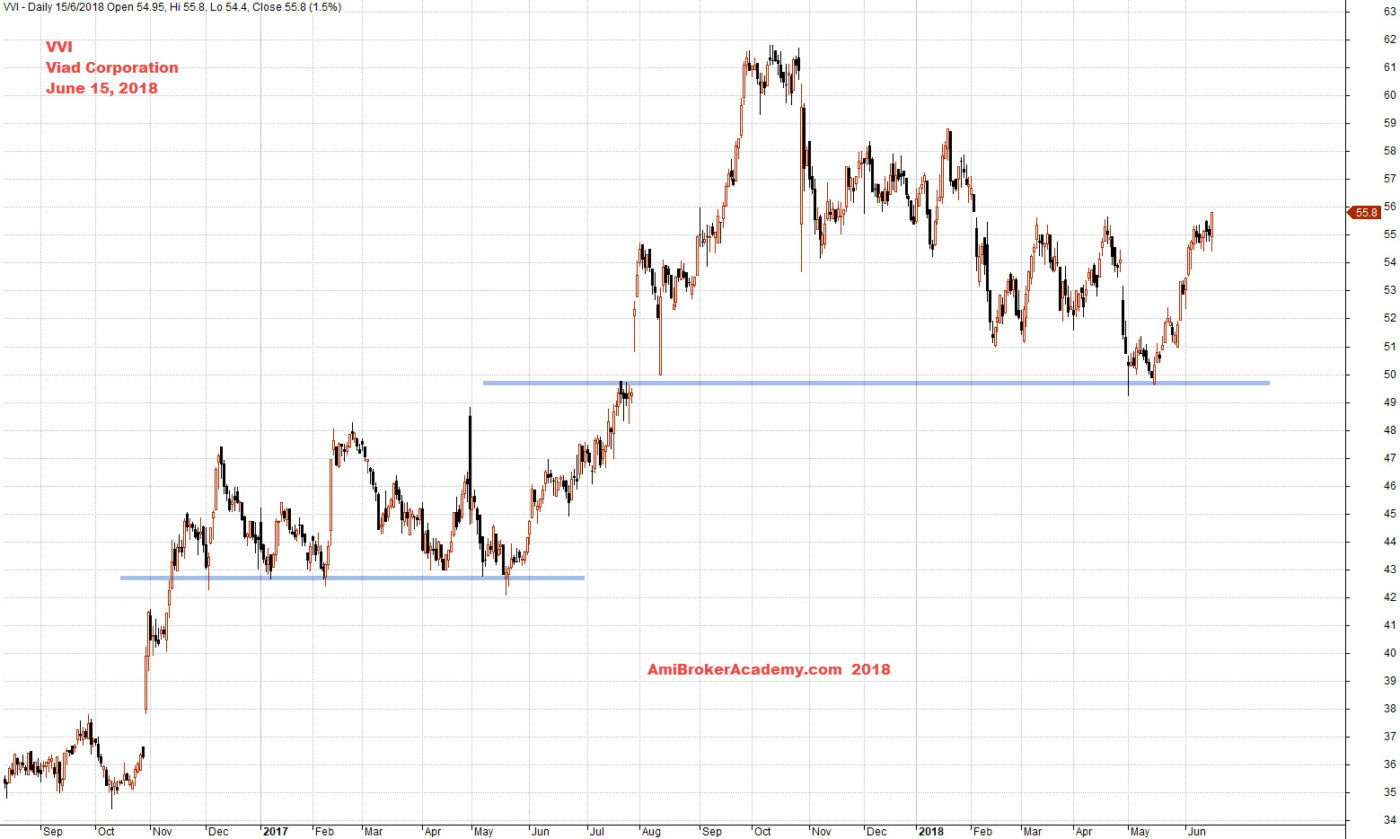
June 15, 2018 Viad Corporation and Support Resistance
VVI Viad Corporation Charting and Sideways and Breakout
See chart, picture worth a thousand words. Manage your risk.
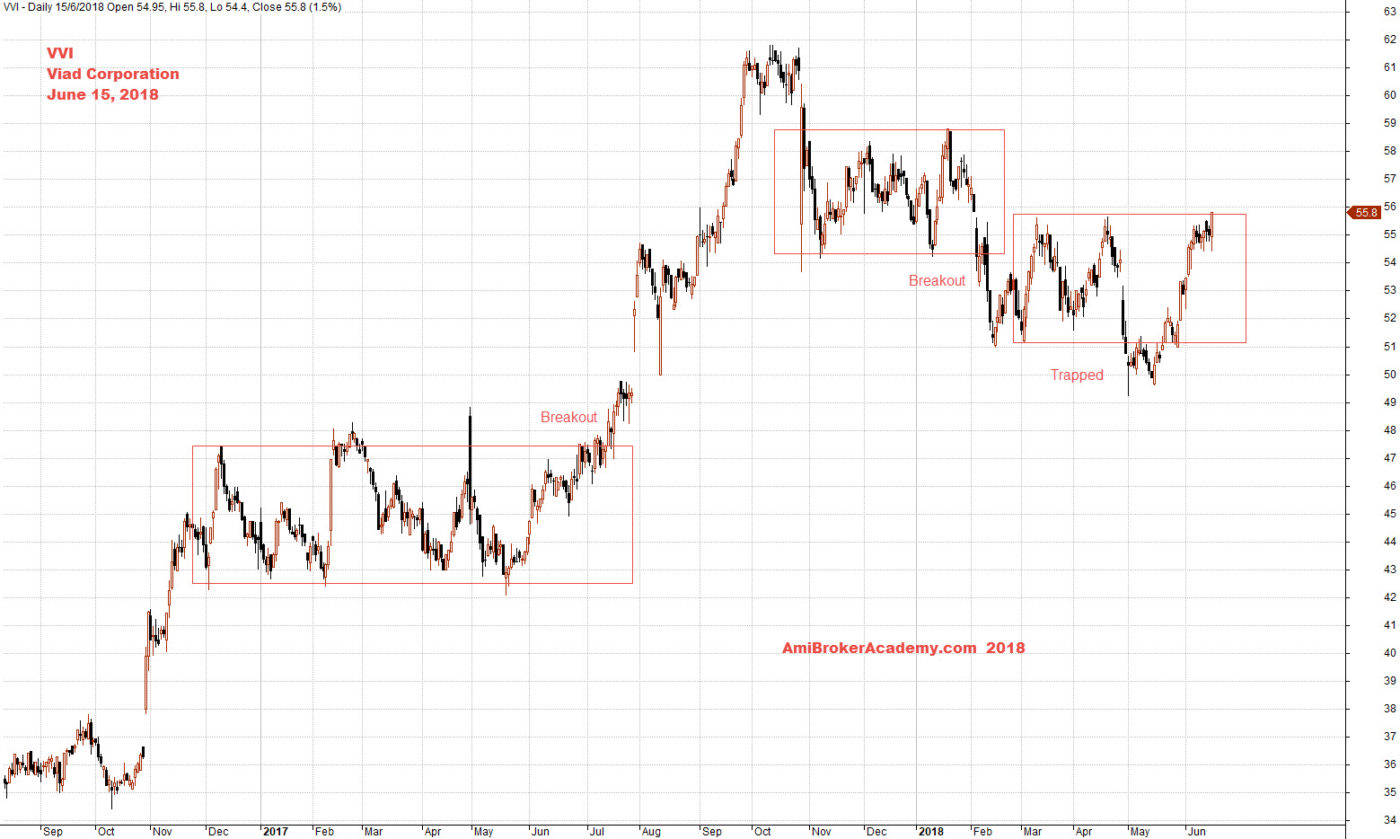
June 15, 2018 Viad Corporation and Sideways and Breakout
Moses US Stock Chart Analysis
AmiBrokerAcademy.com
Disclaimer
The above result is for illustration purpose. It is not meant to be used for buy or sell decision. We do not recommend any particular stocks. If particular stocks of such are mentioned, they are meant as demonstration of Amibroker as a powerful charting software and MACD. Amibroker can program to scan the stocks for buy and sell signals.
These are script generated signals. Not all scan results are shown here. The MACD signal should use with price action. Users must understand what MACD and price action are all about before using them. If necessary you should attend a course to learn more on Technical Analysis (TA) and Moving Average Convergence Divergence, MACD.
Once again, the website does not guarantee any results or investment return based on the information and instruction you have read here. It should be used as learning aids only and if you decide to trade real money, all trading decision should be your own.