8 August, 2018
Thanks for visiting the site.
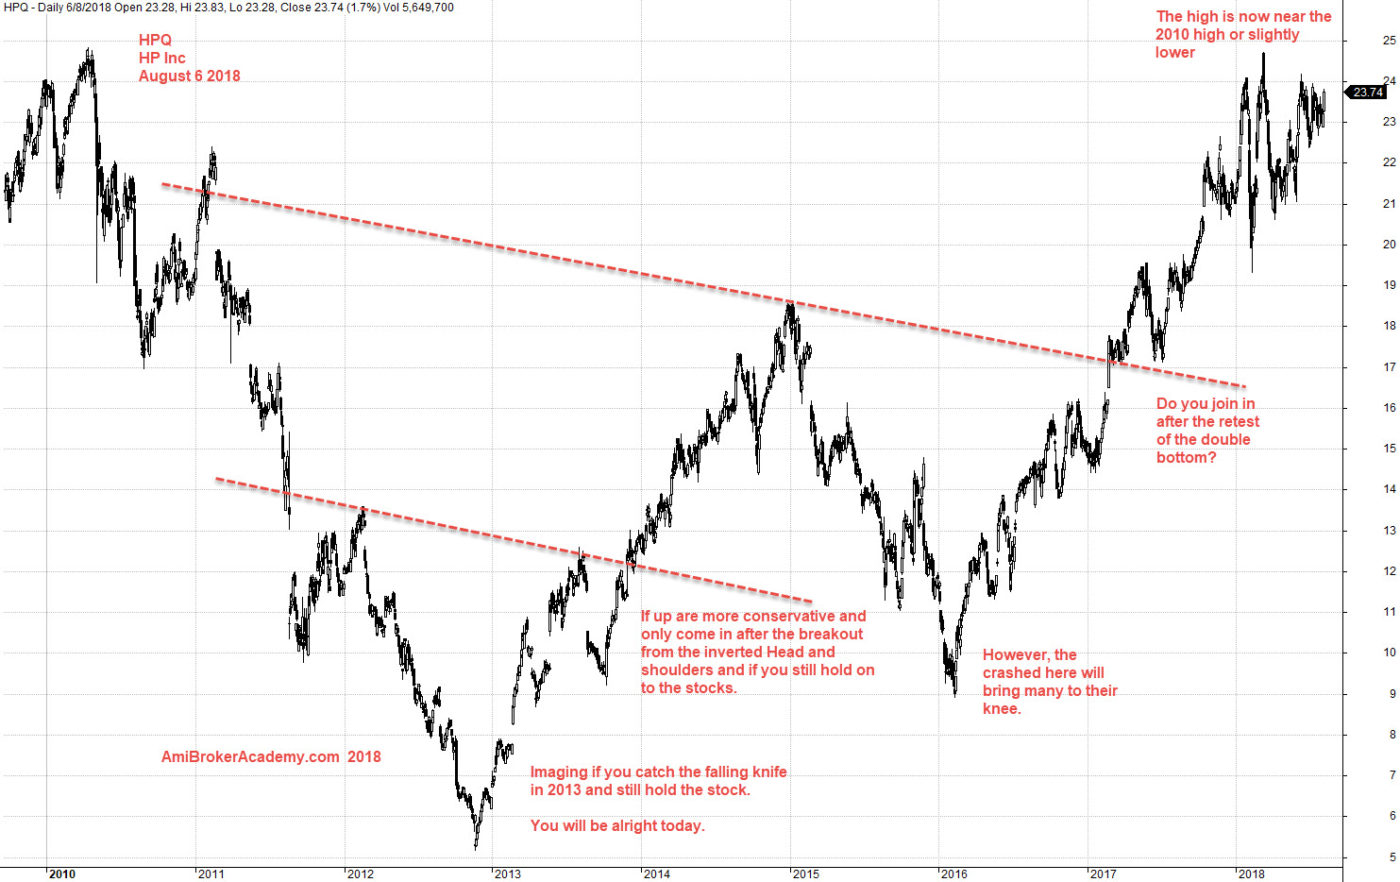
HPQ HP Inc Charting
See posting on patterns, the price action went through inverted head and shoulder, double bottom. And now the price action is testing the high in 2010, after eight years. and for those whom brave enough and catch the falling knife and still hold on to the stock. There are alright. They are really brave.
See chart for more.
August 6, 2018 HP Inc Charting and Think Think
Moses US Stock Chart Analysis
AmiBrokerAcademy.com
Disclaimer
The above result is for illustration purpose. It is not meant to be used for buy or sell decision. We do not recommend any particular stocks. If particular stocks of such are mentioned, they are meant as demonstration of Amibroker as a powerful charting software and MACD. Amibroker can program to scan the stocks for buy and sell signals.
These are script generated signals. Not all scan results are shown here. The MACD signal should use with price action. Users must understand what MACD and price action are all about before using them. If necessary you should attend a course to learn more on Technical Analysis (TA) and Moving Average Convergence Divergence, MACD.
Once again, the website does not guarantee any results or investment return based on the information and instruction you have read here. It should be used as learning aids only and if you decide to trade real money, all trading decision should be your own.