24 October, 2018
Thanks for visiting the site.
Free U.S. Stock MACD Scan
What is MACD?
MACD stands for Moving Average Convergence Divergence, common setting is (12,26,9)
MACD indicator is a trend trading system that makes up of 2 lines. The MACD Line (fast line) and MACD Signal Line (slow line).
1) When the MACD Line crosses over the MACD Signal Line the trend is bullish. When the MACD Line crosses below the MACD Signal the trend is bearish.
2) When the MACD Line crosses above zero line the trend is bullish. When the MACD line crosses below zero line the trend is bearish.
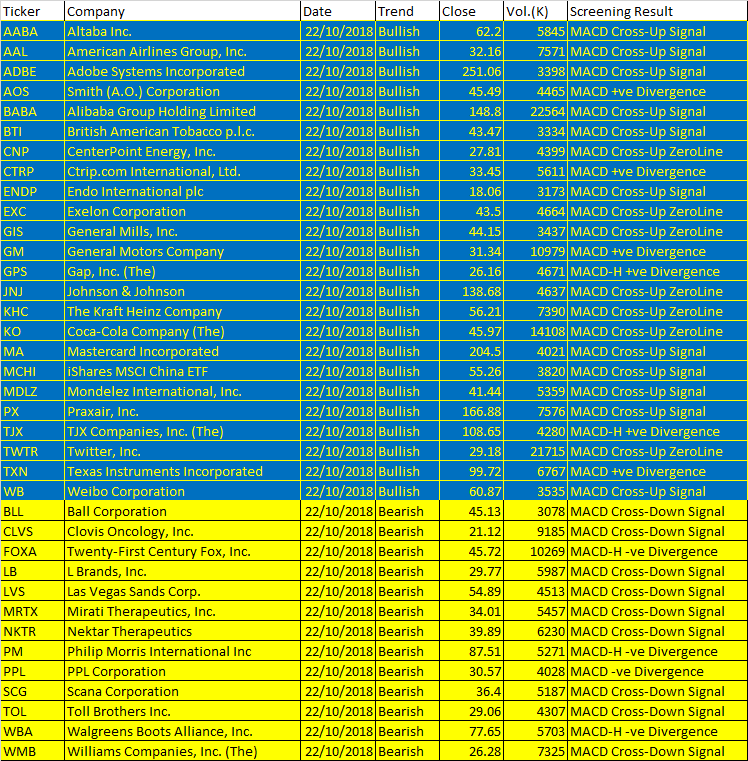
October 22 2018 – Script Generated One-day U.S. Stock MACD Signals
The following are script generated One-day U.S. Stock Market MACD signals using the Powerful AmiBroker’s AFL.
The MACD Setting used is (8,17,9)
| Ticker | Company | Date | Trend | Close | Vol.(K) | Screening Result |
| AABA | Altaba Inc. | 22/10/2018 | Bullish | 62.2 | 5845 | MACD Cross-Up Signal |
| AAL | American Airlines Group, Inc. | 22/10/2018 | Bullish | 32.16 | 7571 | MACD Cross-Up Signal |
| ADBE | Adobe Systems Incorporated | 22/10/2018 | Bullish | 251.06 | 3398 | MACD Cross-Up Signal |
| AOS | Smith (A.O.) Corporation | 22/10/2018 | Bullish | 45.49 | 4465 | MACD +ve Divergence |
| BABA | Alibaba Group Holding Limited | 22/10/2018 | Bullish | 148.8 | 22564 | MACD Cross-Up Signal |
| BTI | British American Tobacco p.l.c. | 22/10/2018 | Bullish | 43.47 | 3334 | MACD Cross-Up Signal |
| CNP | CenterPoint Energy, Inc. | 22/10/2018 | Bullish | 27.81 | 4399 | MACD Cross-Up ZeroLine |
| CTRP | Ctrip.com International, Ltd. | 22/10/2018 | Bullish | 33.45 | 5611 | MACD +ve Divergence |
| ENDP | Endo International plc | 22/10/2018 | Bullish | 18.06 | 3173 | MACD Cross-Up Signal |
| EXC | Exelon Corporation | 22/10/2018 | Bullish | 43.5 | 4664 | MACD Cross-Up ZeroLine |
| GIS | General Mills, Inc. | 22/10/2018 | Bullish | 44.15 | 3437 | MACD Cross-Up ZeroLine |
| GM | General Motors Company | 22/10/2018 | Bullish | 31.34 | 10979 | MACD +ve Divergence |
| GPS | Gap, Inc. (The) | 22/10/2018 | Bullish | 26.16 | 4671 | MACD-H +ve Divergence |
| JNJ | Johnson & Johnson | 22/10/2018 | Bullish | 138.68 | 4637 | MACD Cross-Up ZeroLine |
| KHC | The Kraft Heinz Company | 22/10/2018 | Bullish | 56.21 | 7390 | MACD Cross-Up ZeroLine |
| KO | Coca-Cola Company (The) | 22/10/2018 | Bullish | 45.97 | 14108 | MACD Cross-Up ZeroLine |
| MA | Mastercard Incorporated | 22/10/2018 | Bullish | 204.5 | 4021 | MACD Cross-Up Signal |
| MCHI | iShares MSCI China ETF | 22/10/2018 | Bullish | 55.26 | 3820 | MACD Cross-Up Signal |
| MDLZ | Mondelez International, Inc. | 22/10/2018 | Bullish | 41.44 | 5359 | MACD Cross-Up Signal |
| PX | Praxair, Inc. | 22/10/2018 | Bullish | 166.88 | 7576 | MACD Cross-Up Signal |
| TJX | TJX Companies, Inc. (The) | 22/10/2018 | Bullish | 108.65 | 4280 | MACD-H +ve Divergence |
| TWTR | Twitter, Inc. | 22/10/2018 | Bullish | 29.18 | 21715 | MACD Cross-Up ZeroLine |
| TXN | Texas Instruments Incorporated | 22/10/2018 | Bullish | 99.72 | 6767 | MACD +ve Divergence |
| WB | Weibo Corporation | 22/10/2018 | Bullish | 60.87 | 3535 | MACD Cross-Up Signal |
| BLL | Ball Corporation | 22/10/2018 | Bearish | 45.13 | 3078 | MACD Cross-Down Signal |
| CLVS | Clovis Oncology, Inc. | 22/10/2018 | Bearish | 21.12 | 9185 | MACD Cross-Down Signal |
| FOXA | Twenty-First Century Fox, Inc. | 22/10/2018 | Bearish | 45.72 | 10269 | MACD-H -ve Divergence |
| LB | L Brands, Inc. | 22/10/2018 | Bearish | 29.77 | 5987 | MACD Cross-Down Signal |
| LVS | Las Vegas Sands Corp. | 22/10/2018 | Bearish | 54.89 | 4513 | MACD Cross-Down Signal |
| MRTX | Mirati Therapeutics, Inc. | 22/10/2018 | Bearish | 34.01 | 5457 | MACD Cross-Down Signal |
| NKTR | Nektar Therapeutics | 22/10/2018 | Bearish | 39.89 | 6230 | MACD Cross-Down Signal |
| PM | Philip Morris International Inc | 22/10/2018 | Bearish | 87.51 | 5271 | MACD-H -ve Divergence |
| PPL | PPL Corporation | 22/10/2018 | Bearish | 30.57 | 4028 | MACD -ve Divergence |
| SCG | Scana Corporation | 22/10/2018 | Bearish | 36.4 | 5187 | MACD Cross-Down Signal |
| TOL | Toll Brothers Inc. | 22/10/2018 | Bearish | 29.06 | 4307 | MACD Cross-Down Signal |
| WBA | Walgreens Boots Alliance, Inc. | 22/10/2018 | Bearish | 77.65 | 5703 | MACD-H -ve Divergence |
| WMB | Williams Companies, Inc. (The) | 22/10/2018 | Bearish | 26.28 | 7325 | MACD Cross-Down Signal |
If you can see the whole chart, “press Ctrl and -” to zoom out.
October 23, 2018 US Stock One-day MACD Signal
MACD Example – AT &T
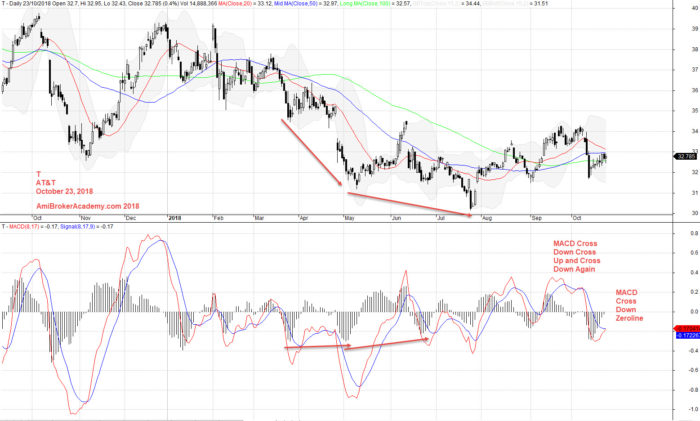
October 23, 2018 AT&T and MACD
Moses U.S. Stock MACD Scan
AmiBroker Academy.com
Disclaimer
The above result is for illustration purpose. It is not meant to be used for buy or sell decision. We do not recommend any particular stocks. If particular stocks of such are mentioned, they are meant as demonstration of Amibroker as a powerful charting software and MACD. Amibroker can program to scan the stocks for buy and sell signals.
These are script generated signals. Not all scan results are shown here. The MACD signal should use with price action. Users must understand what MACD and price action are all about before using them. If necessary you should attend a course to learn more on Technical Analysis (TA) and Moving Average Convergence Divergence, MACD.
Once again, the website does not guarantee any results or investment return based on the information and instruction you have read here. It should be used as learning aids only and if you decide to trade real money, all trading decision should be your own.