9 November, 2018
Thanks for visiting the site.
Free U.S. Stock Five-day MACD Scan
What is MACD?
MACD stands for Moving Average Convergence Divergence, common setting is (12,26,9)
MACD indicator is a trend trading system that makes up of 2 lines. The MACD Line (fast line) and MACD Signal Line (slow line).
1) When the MACD Line crosses over the MACD Signal Line the trend is bullish. When the MACD Line crosses below the MACD Signal the trend is bearish.
2) When the MACD Line crosses above zero line the trend is bullish. When the MACD line crosses below zero line the trend is bearish.
MACD Example – Square Inc
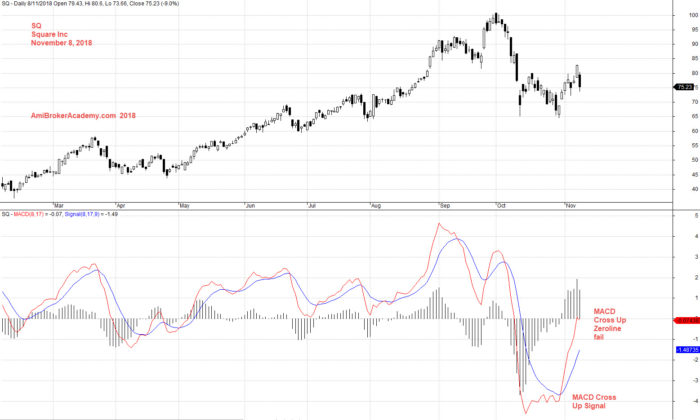
November 8, 2018 Square Inc and MACD
2 to 8 November 2018 AFL Script Generated Five-day U.S. Stock MACD Signals
The following are script generated One-day U.S. Stock Market MACD signals using the Powerful AmiBroker’s AFL.
The MACD Setting used is (8,17,9)
| Ticker | Company | Date | Bull/Bear | Close | Vol.(K) | Screening Result |
| BAC | Bank of America Corporation | 8/11/2018 | Bull | 28.87 | 49390 | MACD Cross-Up ZeroLine |
| BK | Bank Of New York Mellon Corporation (The) | 8/11/2018 | Bull | 49.03 | 5826 | MACD Cross-Up ZeroLine |
| DWDP | DowDuPont Inc. | 8/11/2018 | Bull | 59.44 | 12218 | MACD Cross-Up ZeroLine |
| FTNT | Fortinet, Inc. | 2/11/2018 | Bull | 72.56 | 5927 | MACD Cross-Up Signal |
| GIS | General Mills, Inc. | 2/11/2018 | Bull | 42.17 | 9583 | MACD Cross-Up Signal |
| IVZ | Invesco Plc | 7/11/2018 | Bull | 21.59 | 5146 | MACD Cross-Up ZeroLine |
| IVZ | Invesco Plc | 8/11/2018 | Bull | 21.78 | 6197 | MACD Cross-Up ZeroLine |
| IWM | 8/11/2018 | Bull | 156.99 | 14966 | MACD Cross-Up ZeroLine | |
| JCI | Johnson Controls International plc | 8/11/2018 | Bull | 34.48 | 9372 | MACD Cross-Up ZeroLine |
| MSFT | Microsoft Corporation | 2/11/2018 | Bull | 106.16 | 37680 | MACD Cross-Up ZeroLine |
| MSFT | Microsoft Corporation | 8/11/2018 | Bull | 111.75 | 25480 | MACD Cross-Up ZeroLine |
| OLED | Universal Display Corporation | 2/11/2018 | Bull | 103.06 | 7580 | MACD-H +ve Divergence |
| PFE | Pfizer, Inc. | 7/11/2018 | Bull | 44.4 | 34910 | MACD Cross-Up ZeroLine |
| PFE | Pfizer, Inc. | 8/11/2018 | Bull | 43.85 | 24380 | MACD Cross-Up ZeroLine |
| SGMS | Scientific Games Corp | 8/11/2018 | Bull | 26.74 | 5437 | MACD Cross-Up ZeroLine |
| WMGI | Wright Medical Group N.V. | 8/11/2018 | Bull | 29.75 | 5535 | MACD Cross-Up ZeroLine |
| XEL | Xcel Energy Inc. | 8/11/2018 | Bull | 49.33 | 10503 | MACD Cross-Up Signal |
| CTRP | Ctrip.com International, Ltd. | 8/11/2018 | Bear | 27.89 | 30213 | MACD Cross-Down Signal |
| DVA | DaVita Inc. | 7/11/2018 | Bear | 76.08 | 6254 | MACD -ve Divergence |
| DVA | DaVita Inc. | 8/11/2018 | Bear | 70.15 | 5964 | MACD -ve Divergence |
| FOSL | Fossil Group, Inc. | 8/11/2018 | Bear | 21.85 | 6650 | MACD Cross-Down Signal |
| HAIN | The Hain Celestial Group, Inc. | 8/11/2018 | Bear | 22.51 | 6380 | MACD Cross-Down Signal |
| IMMU | Immunomedics, Inc. | 8/11/2018 | Bear | 22.02 | 5315 | MACD Cross-Down Signal |
| JD | JD.com, Inc. | 5/11/2018 | Bear | 24.15 | 10520 | MACD Cross-Down ZeroLine |
| JD | JD.com, Inc. | 8/11/2018 | Bear | 22.4 | 17324 | MACD Cross-Down ZeroLine |
| LEN | Lennar Corporation | 8/11/2018 | Bear | 41.9 | 6355 | MACD Cross-Down ZeroLine |
| NRG | NRG Energy, Inc. | 8/11/2018 | Bear | 36.99 | 8486 | MACD -ve Divergence |
| PCG | Pacific Gas & Electric Co. | 8/11/2018 | Bear | 47.8 | 7941 | MACD -ve Divergence |
| PRGO | Perrigo Company | 8/11/2018 | Bear | 62.88 | 7873 | MACD Cross-Down Signal |
| QCOM | QUALCOMM Incorporated | 8/11/2018 | Bear | 58.05 | 32154 | MACD Cross-Down Signal |
| SQ | Square, Inc. | 7/11/2018 | Bear | 82.69 | 24042 | MACD Cross-Down ZeroLine |
| SQ | Square, Inc. | 8/11/2018 | Bear | 75.23 | 35786 | MACD Cross-Down ZeroLine |
| TLND | Talend S.A. | 8/11/2018 | Bear | 43.43 | 5357 | MACD Cross-Down Signal |
| TTWO | Take-Two Interactive Software, Inc. | 8/11/2018 | Bear | 119.14 | 7456 | MACD Cross-Down ZeroLine |
| TVIX | VelocityShares Daily 2x VIX Short-Term ETN | 8/11/2018 | Bear | 35.96 | 10667 | MACD Cross-Down ZeroLine |
| ZAYO | Zayo Group Holdings, Inc. | 8/11/2018 | Bear | 22.56 | 18985 | MACD Cross-Down Signal |
if you can see the full chart, “press Ctrl and -” to zoom out and see the entire chart.

November 2 to 8, 2018 US Stock Five-day MACD Screener Signals
Moses U.S. Stock MACD Scan
AmiBroker Academy.com
Disclaimer
The above result is for illustration purpose. It is not meant to be used for buy or sell decision. We do not recommend any particular stocks. If particular stocks of such are mentioned, they are meant as demonstration of Amibroker as a powerful charting software and MACD. Amibroker can program to scan the stocks for buy and sell signals.
These are script generated signals. Not all scan results are shown here. The MACD signal should use with price action. Users must understand what MACD and price action are all about before using them. If necessary you should attend a course to learn more on Technical Analysis (TA) and Moving Average Convergence Divergence, MACD.
Once again, the website does not guarantee any results or investment return based on the information and instruction you have read here. It should be used as learning aids only and if you decide to trade real money, all trading decision should be your own.