17 February, 2020
Welcome!
Welcome to AmiBrokerAcademy.com. Thanks for visiting the site.
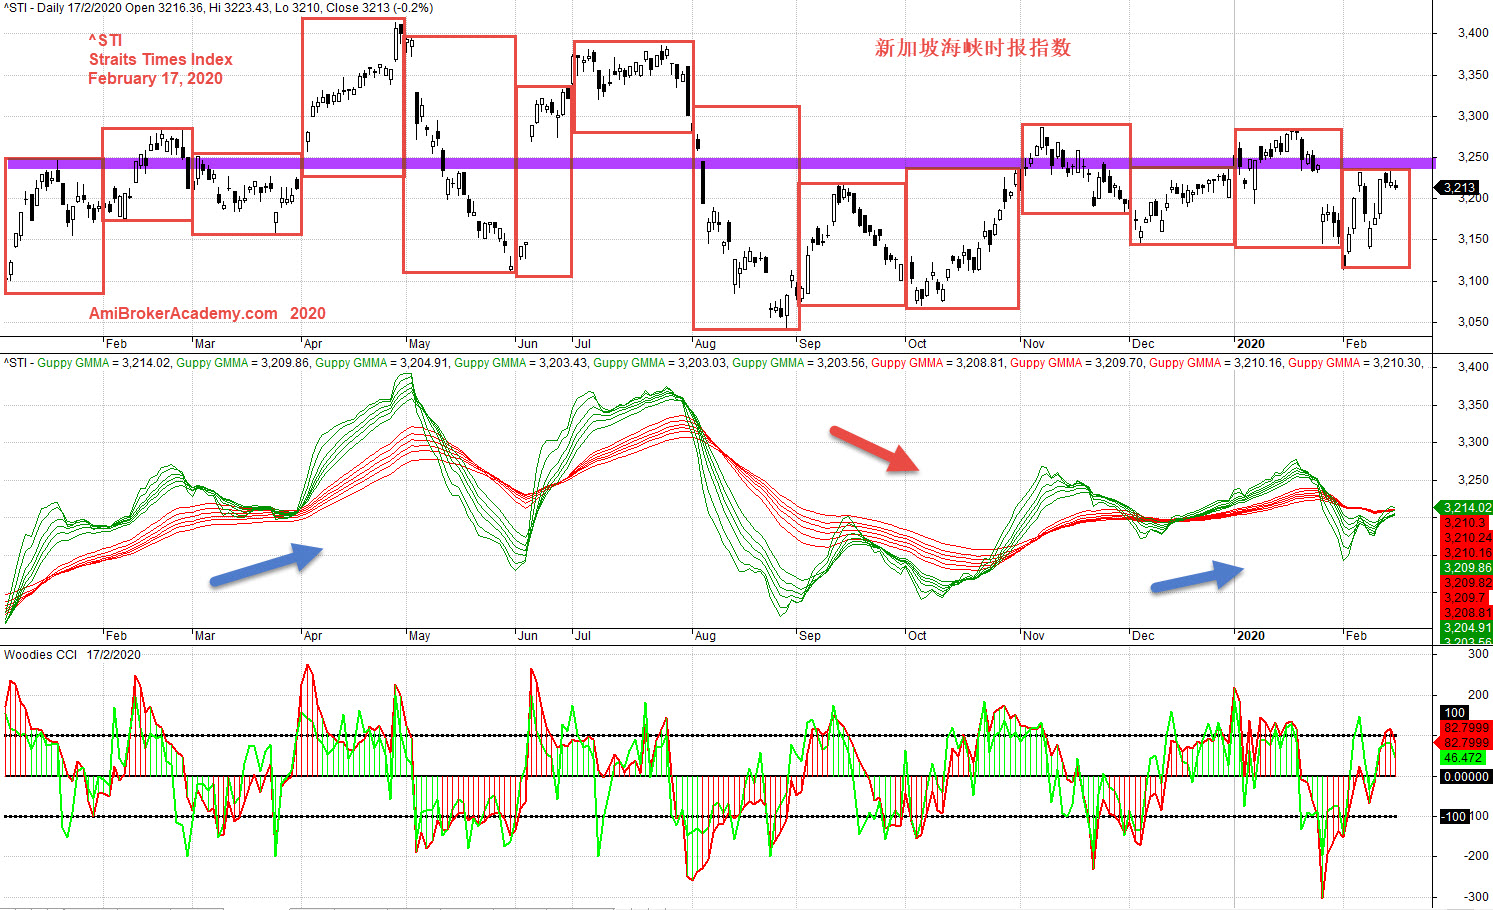
^STI Straits Times Index Charting
Study Singapore Straits Times Index 新加坡海峡时报指数 stock chart price action and GMMA and Woodies CCI.
See chart, picture worth a thousand words.
Manage your expectation.
You can spot many H M Gartley pattern, ABCD.
Moving Average is a great visual tool, add GMMA to spot the longer-term trend. See chart.
To find entry, use Woodies CCI to spot the shorter term trend.
Remember to trade what you see and not what you think.
Manage your risk.
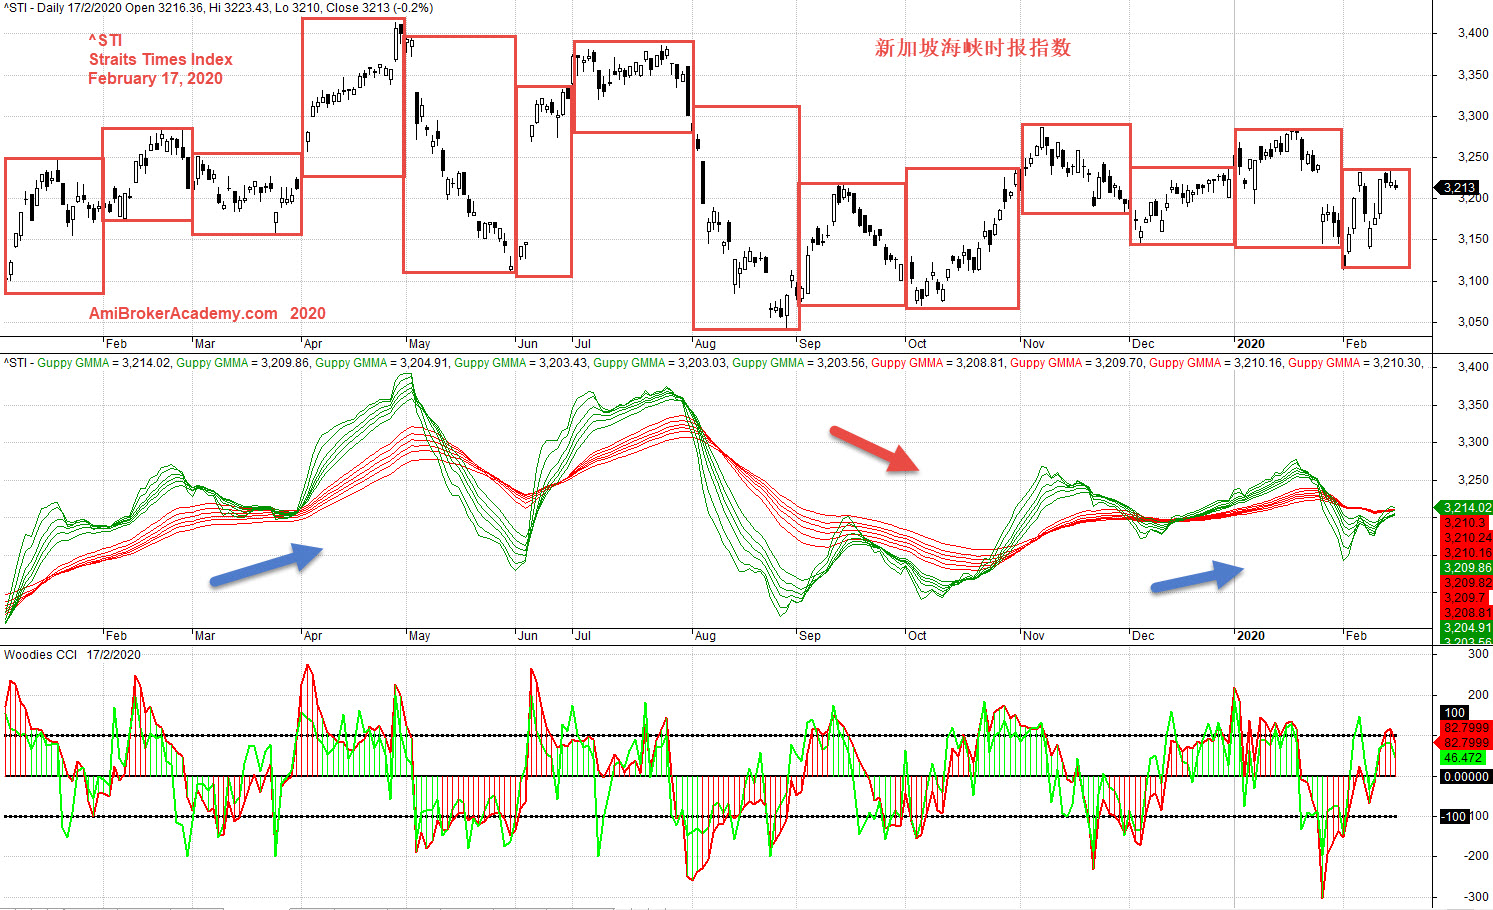
Can you see a key level? 3200 points
Moses Stock Observation
AmiBrokerAcademy.com
Disclaimer
The above result is for illustration purpose. It is not meant to be used for buy or sell decision. We do not recommend any particular stocks. If particular stocks of such are mentioned, they are meant as demonstration of Amibroker as a powerful charting software and MACD. Amibroker can program to scan the stocks for buy and sell signals.
These are script generated signals. Not all scan results are shown here. The MACD signal should use with price action. Users must understand what MACD and price action are all about before using them. If necessary you should attend a course to learn more on Technical Analysis (TA) and Moving Average Convergence Divergence, MACD.
Once again, the website does not guarantee any results or investment return based on the information and instruction you have read here. It should be used as learning aids only and if you decide to trade real money, all trading decision should be your own.