2 March, 2020
Welcome!
Welcome to AmiBrokerAcademy.com. Thanks for visiting the site.
Crystal Ball
MACD, MACD divergence is a crystal ball to many of the Divergence traders.
But, do remember, all set up can fail.
Have fun!
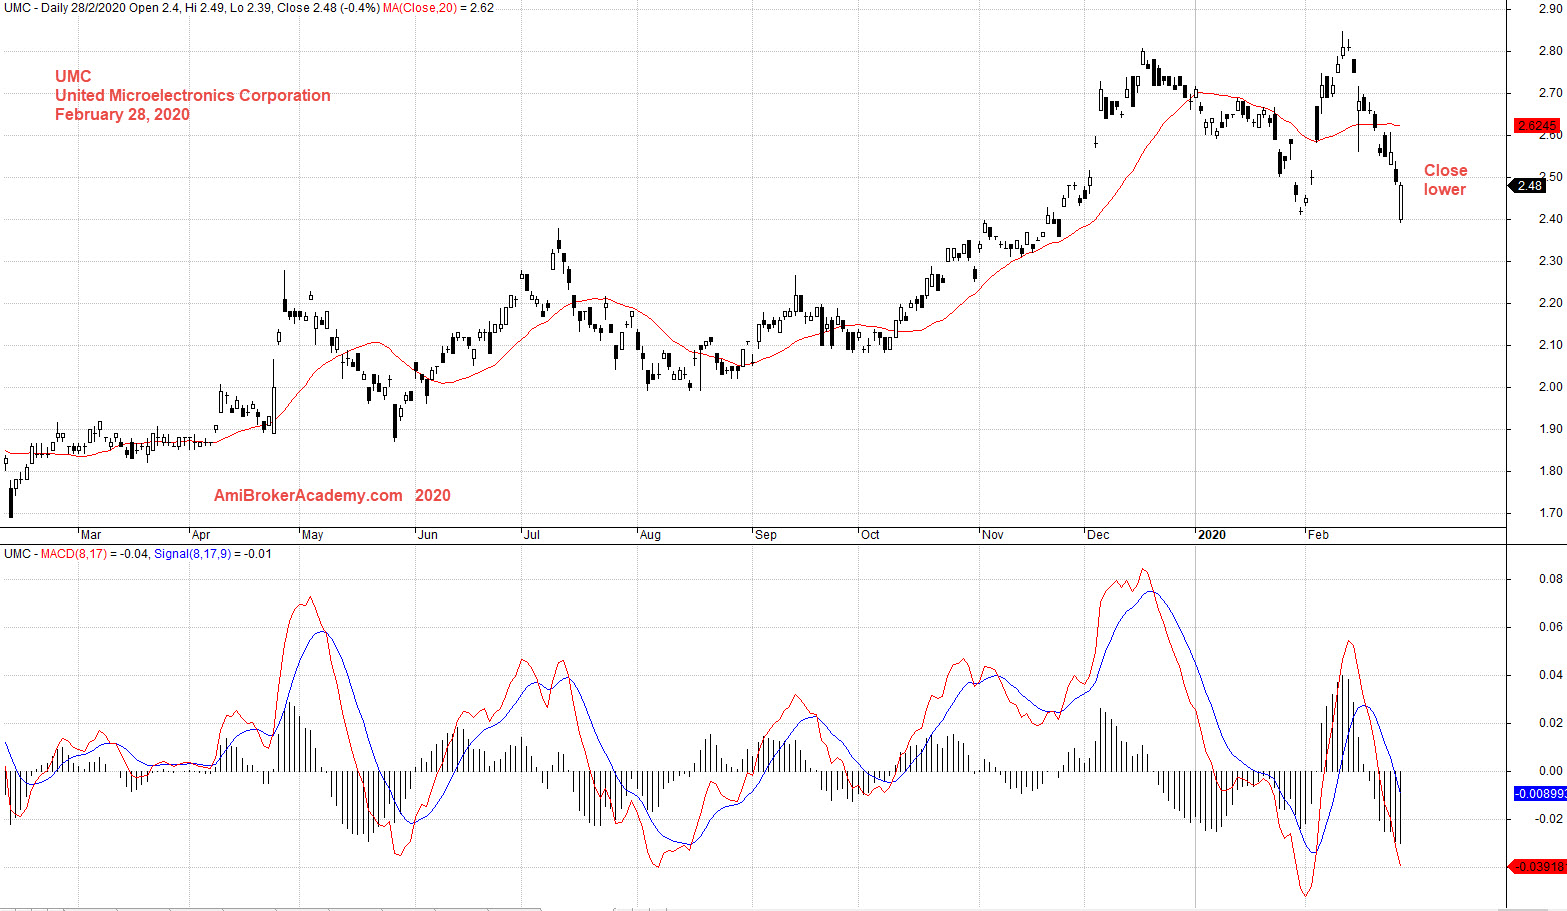
UMC United Microelectronics Corporation Charting
Study United Microelectronics Corporation stock chart price action, MACD Divergence.
See chart, picture worth a thousand words.
Manage your expectation.
Remember to trade what you see and not what you think.
Divergence
To learn more about divergence or patterns, you can read more from babypips website.
Manage your risk.
When to Buy Again?
Buy support and sell resistance. For now, wait. Price Action has continue to go south. 20 MA can’t support the fall. Now price action retest the same low that happen in end January or beginning of February.
Moses Stock Observation
AmiBrokerAcademy.com
Disclaimer
The above result is for illustration purpose. It is not meant to be used for buy or sell decision. We do not recommend any particular stocks. If particular stocks of such are mentioned, they are meant as demonstration of Amibroker as a powerful charting software and MACD. Amibroker can program to scan the stocks for buy and sell signals.
These are script generated signals. Not all scan results are shown here. The MACD signal should use with price action. Users must understand what MACD and price action are all about before using them. If necessary you should attend a course to learn more on Technical Analysis (TA) and Moving Average Convergence Divergence, MACD.
Once again, the website does not guarantee any results or investment return based on the information and instruction you have read here. It should be used as learning aids only and if you decide to trade real money, all trading decision should be your own.