March 3, 2020
Welcome to AmiBrokerAcademy.com. Thanks for visiting the site.
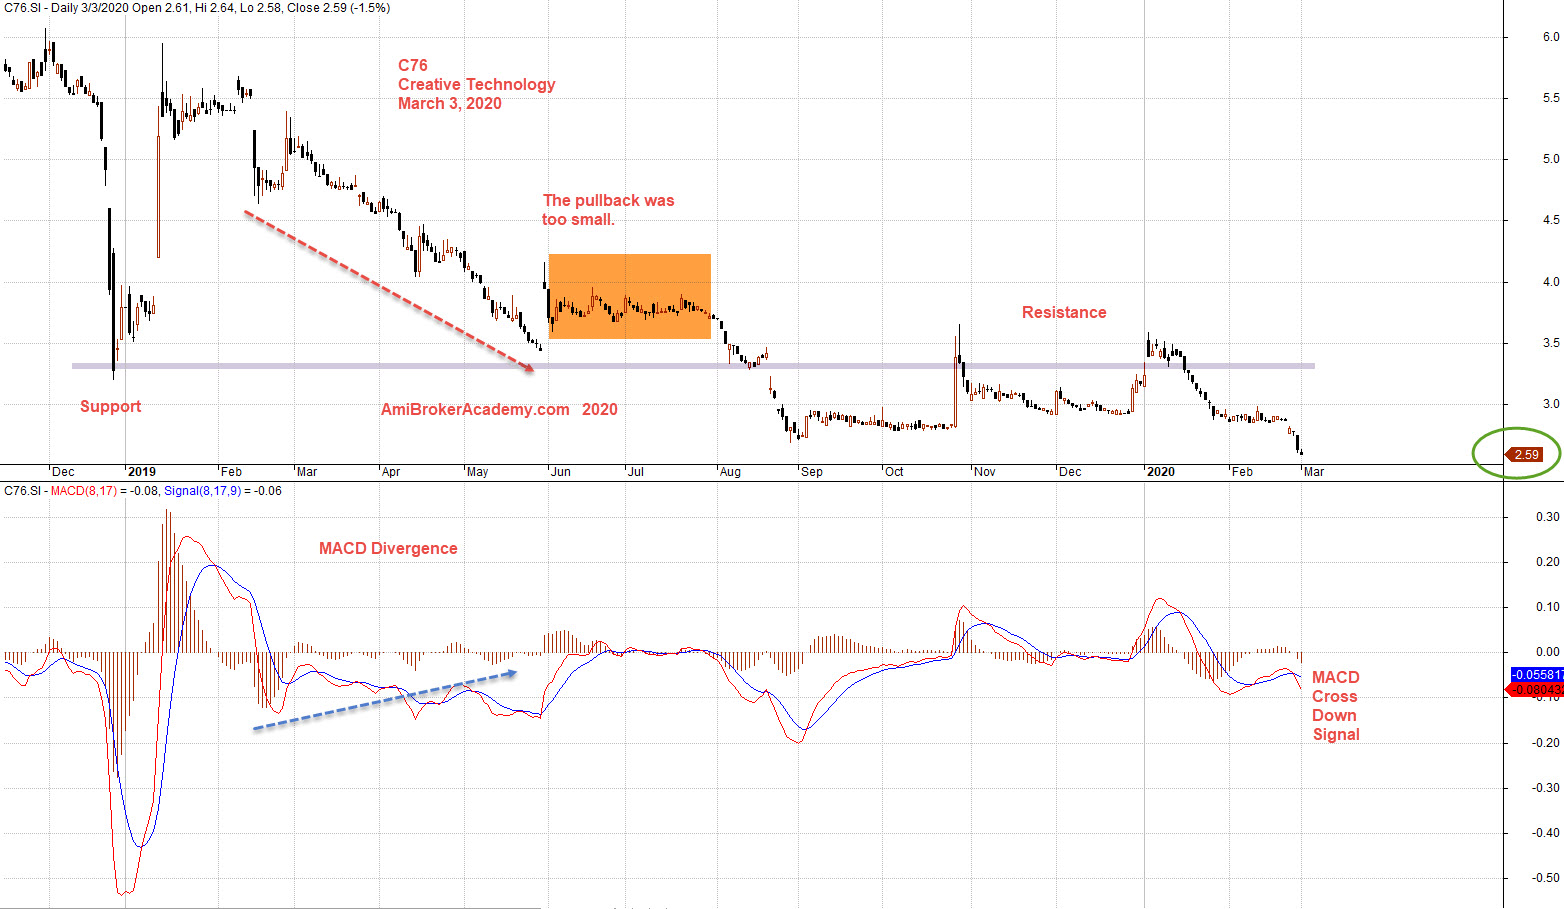
C76.SI Creative Technology 创新科技 Stock Charting
Study Creative Technology 创新科技 stock chart price action and MACD.
See chart, picture worth a thousand words.
Look back last fifteen months, see price action drop from the high at 6 dollars to the low below 3.5 dollars, like dead cat. And the dead cat bounce was supper. retest the high near 6 dollars.
But after eight months, the price action go below 3.5 dollars. This confirm the dead cat bounce bull reversal always fail. The only different is the fail take longer time to happen.
Trade what you see and not what you think. Be smart.
Trade with your eyes open.
Moses Stock Observation
AmiBrokerAcademy.com
Disclaimer
The above result is for illustration purpose. It is not meant to be used for buy or sell decision. We do not recommend any particular stocks. If particular stocks of such are mentioned, they are meant as demonstration of Amibroker as a powerful charting software and MACD. Amibroker can program to scan the stocks for buy and sell signals.
These are script generated signals. Not all scan results are shown here. The MACD signal should use with price action. Users must understand what MACD and price action are all about before using them. If necessary you should attend a course to learn more on Technical Analysis (TA) and Moving Average Convergence Divergence, MACD.
Once again, the website does not guarantee any results or investment return based on the information and instruction you have read here. It should be used as learning aids only and if you decide to trade real money, all trading decision should be your own.