11 January, 2019
Think think got more things.
Thanks for visiting the site.
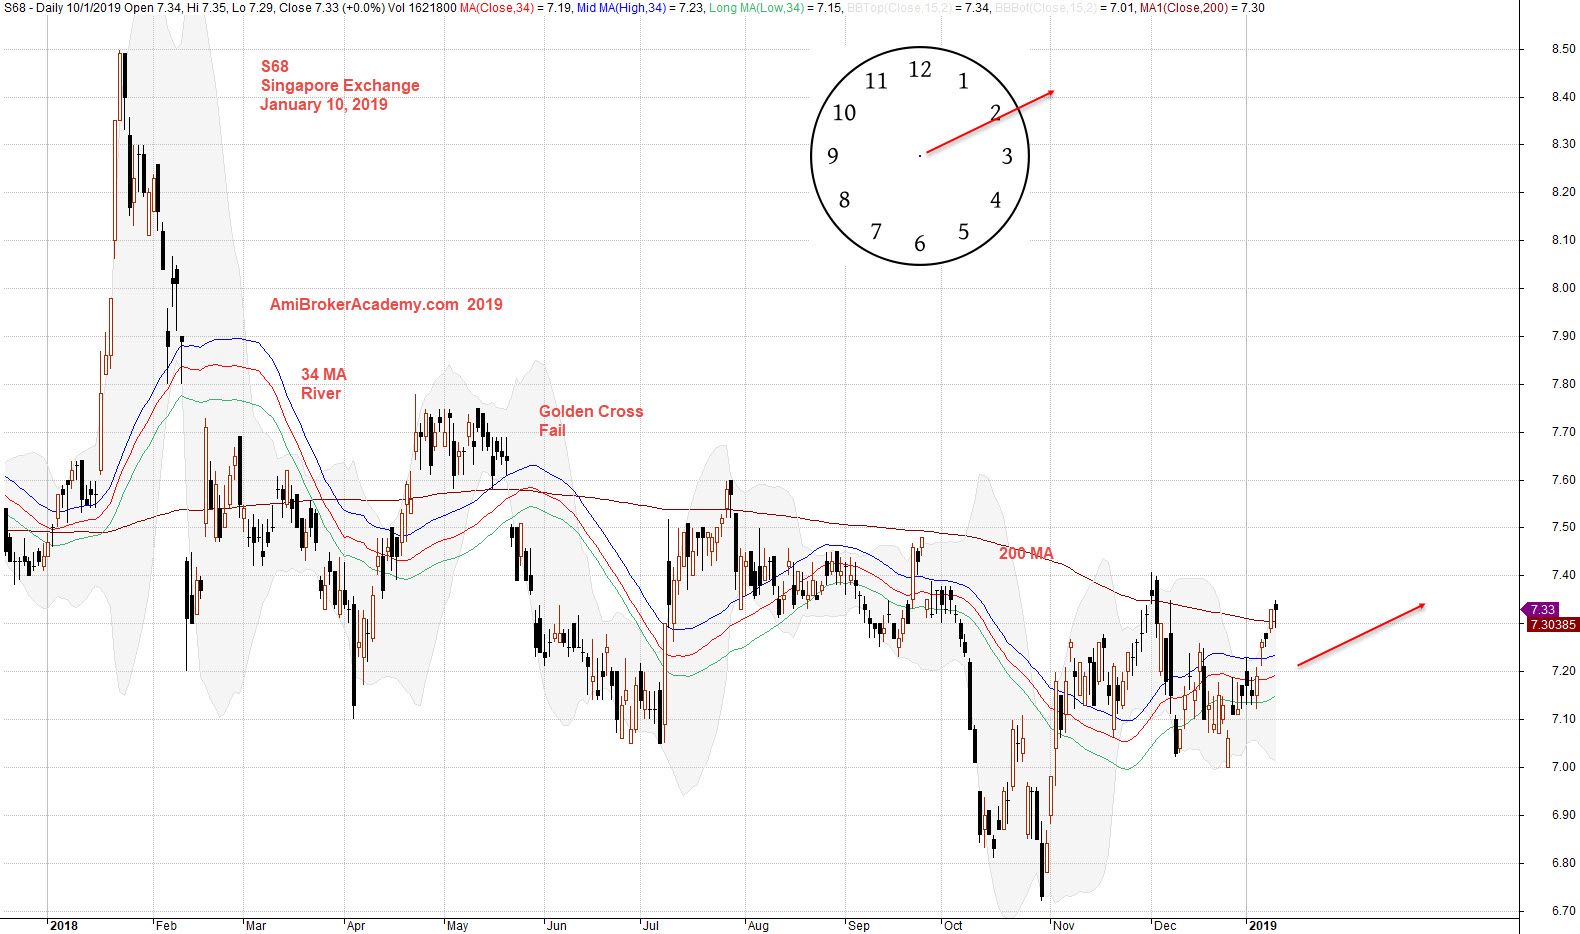
S68 Singapore Exchange Charting
Study Singapore Exchange stock chart. Using great visual tool, moving average. Add 34 period high, low and close moving average.
We see price action close below MA, and stay below MA. Price action resisted by MA. MA moving in zigzag manner.
Fast MA cross below slow MA, dead cross and try to cross up again, golden gross but fail.
Trade with your eyes open.
Add MACD indicator, see +ve divergence. Price action continue to form lower low, and MACD Histogram forms higher low. Trade with eyes open.

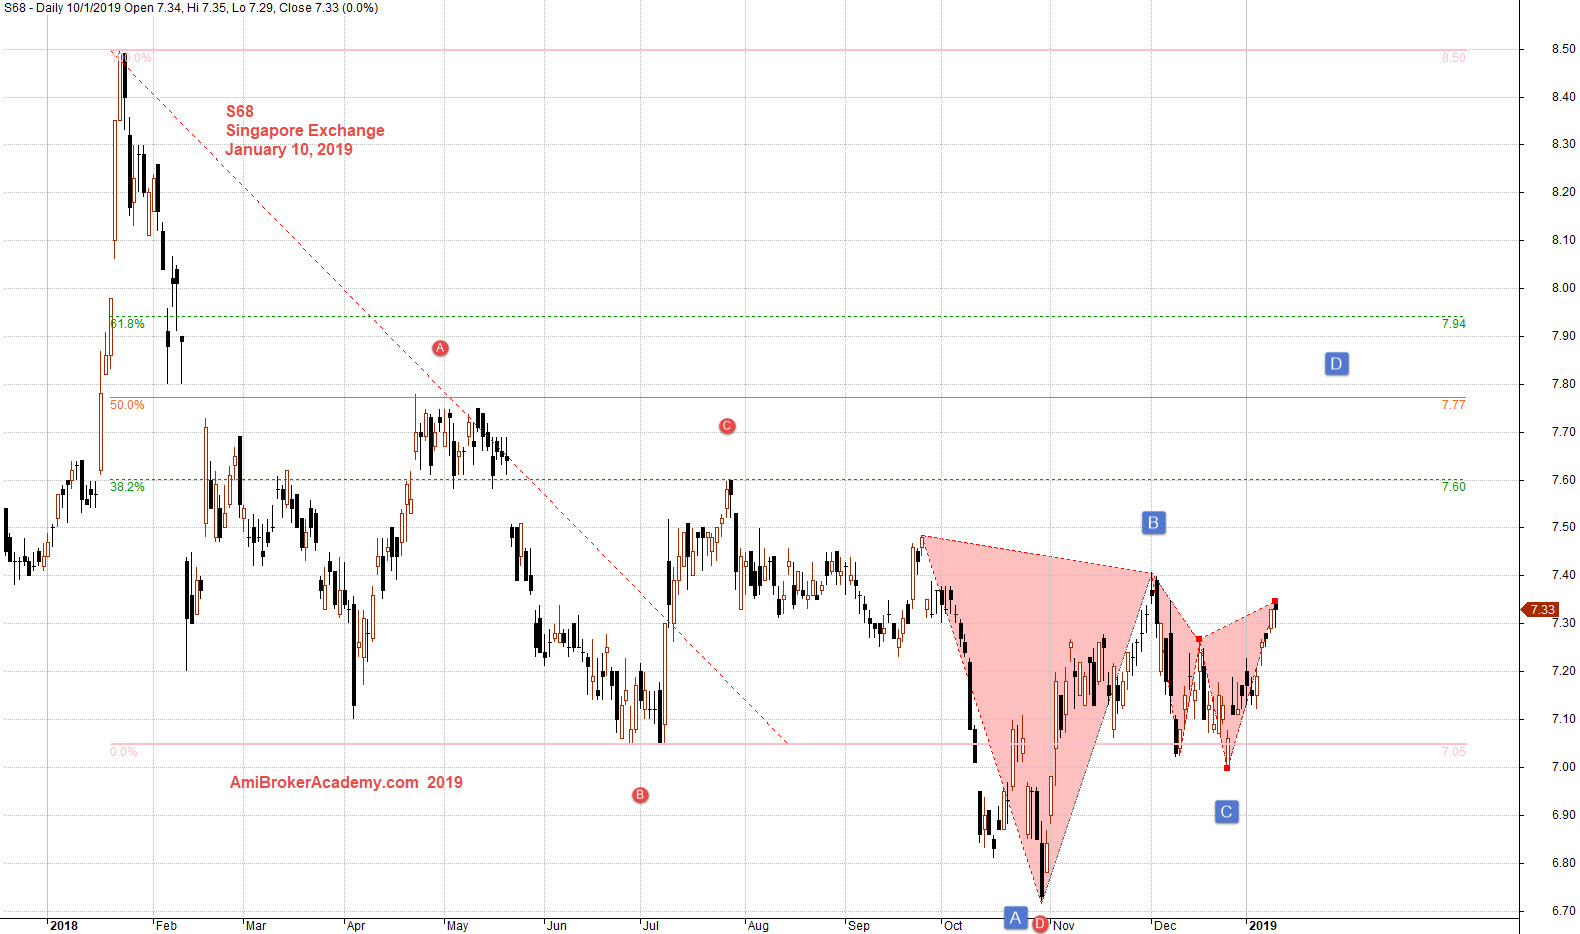
January 10, 2019 Singapore Exchange and MACD
Swing high to low, we see the Fibo retracement. Price action after testing the low and pull back. Price action test the 38% level and fail.
Moses Stock Chart Analysis
AmiBrokerAcademy.com
Disclaimer
The above result is for illustration purpose. It is not meant to be used for buy or sell decision. We do not recommend any particular stocks. If particular stocks of such are mentioned, they are meant as demonstration of Amibroker as a powerful charting software and MACD. Amibroker can program to scan the stocks for buy and sell signals.
These are script generated signals. Not all scan results are shown here. The MACD signal should use with price action. Users must understand what MACD and price action are all about before using them. If necessary you should attend a course to learn more on Technical Analysis (TA) and Moving Average Convergence Divergence, MACD.
Once again, the website does not guarantee any results or investment return based on the information and instruction you have read here. It should be used as learning aids only and if you decide to trade real money, all trading decision should be your own.