November 12, 2018
Thanks for visiting the site.
There is a reason for everything. Perhaps at the moment you do not have the insight.
Moses Stock Analysis
^STI Straits Times Index Charting
Buy low sell high, buy support sell resistance.
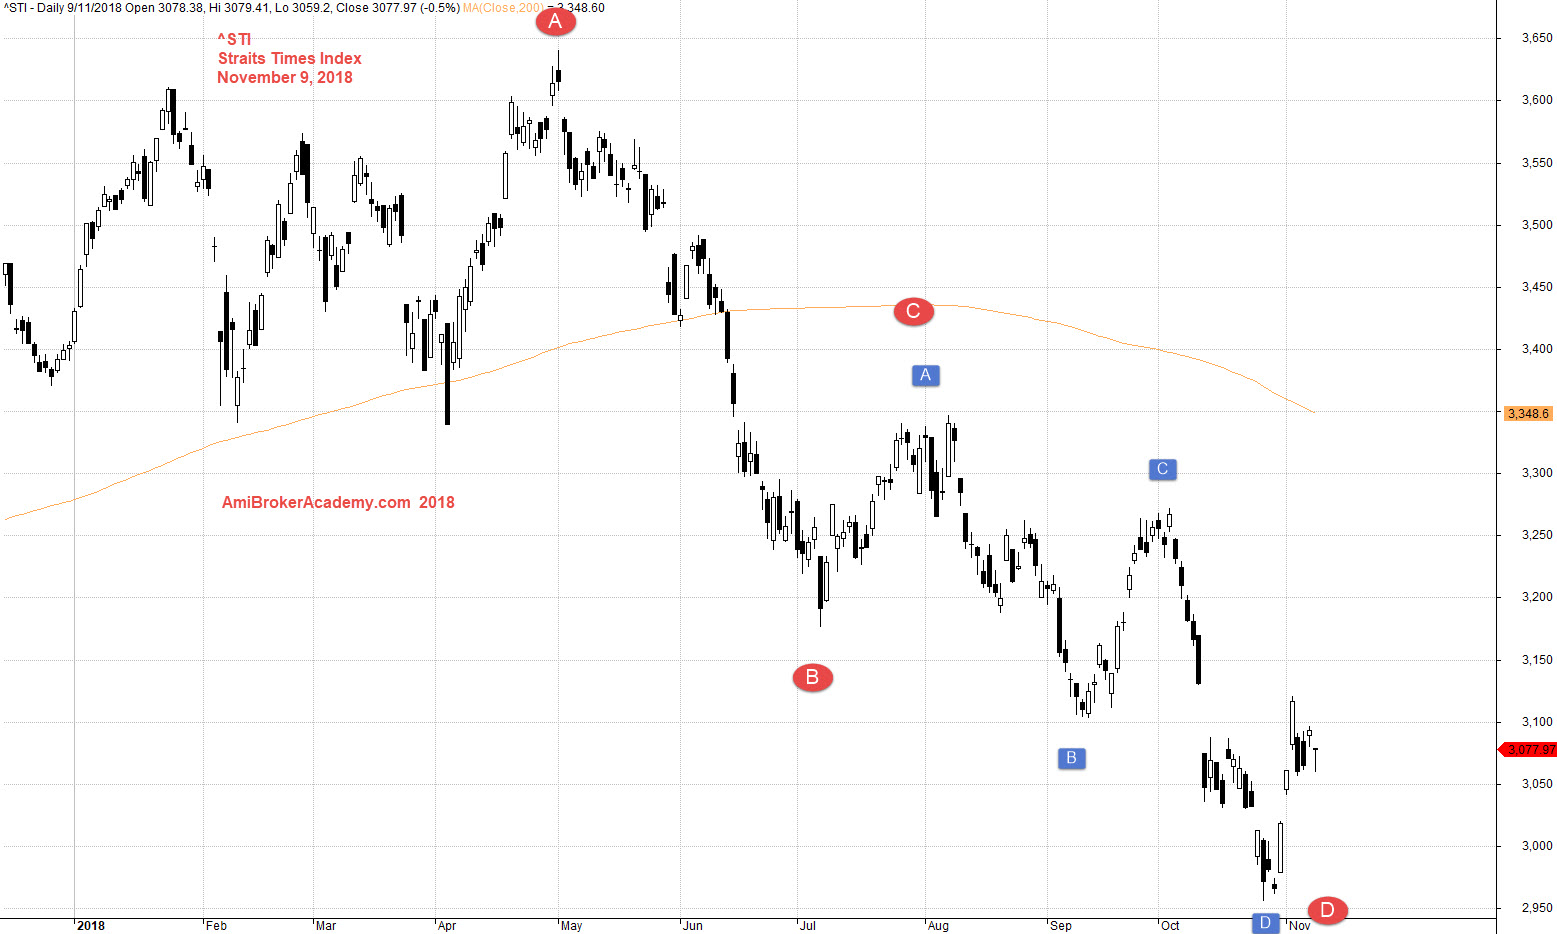
See chart, the price action of ST Index chart.
Apply buy low sell high and buy hold strategy. The price action after test the high of 3650 level, the price action move in H M Gartley 222 pattern, the price action has completed the CD leg, and landed 2950 level.
So, for the BHS, buy hold strategy. The price action now pullback after test the resistance. See chart.
Trade with eyes open, manage your risk.
November 9, 2018 Straits Times Index and Chart Pattern
Add the moving average a great visual tools. See a dead cross, the fast MA close below slow MA. See chart.
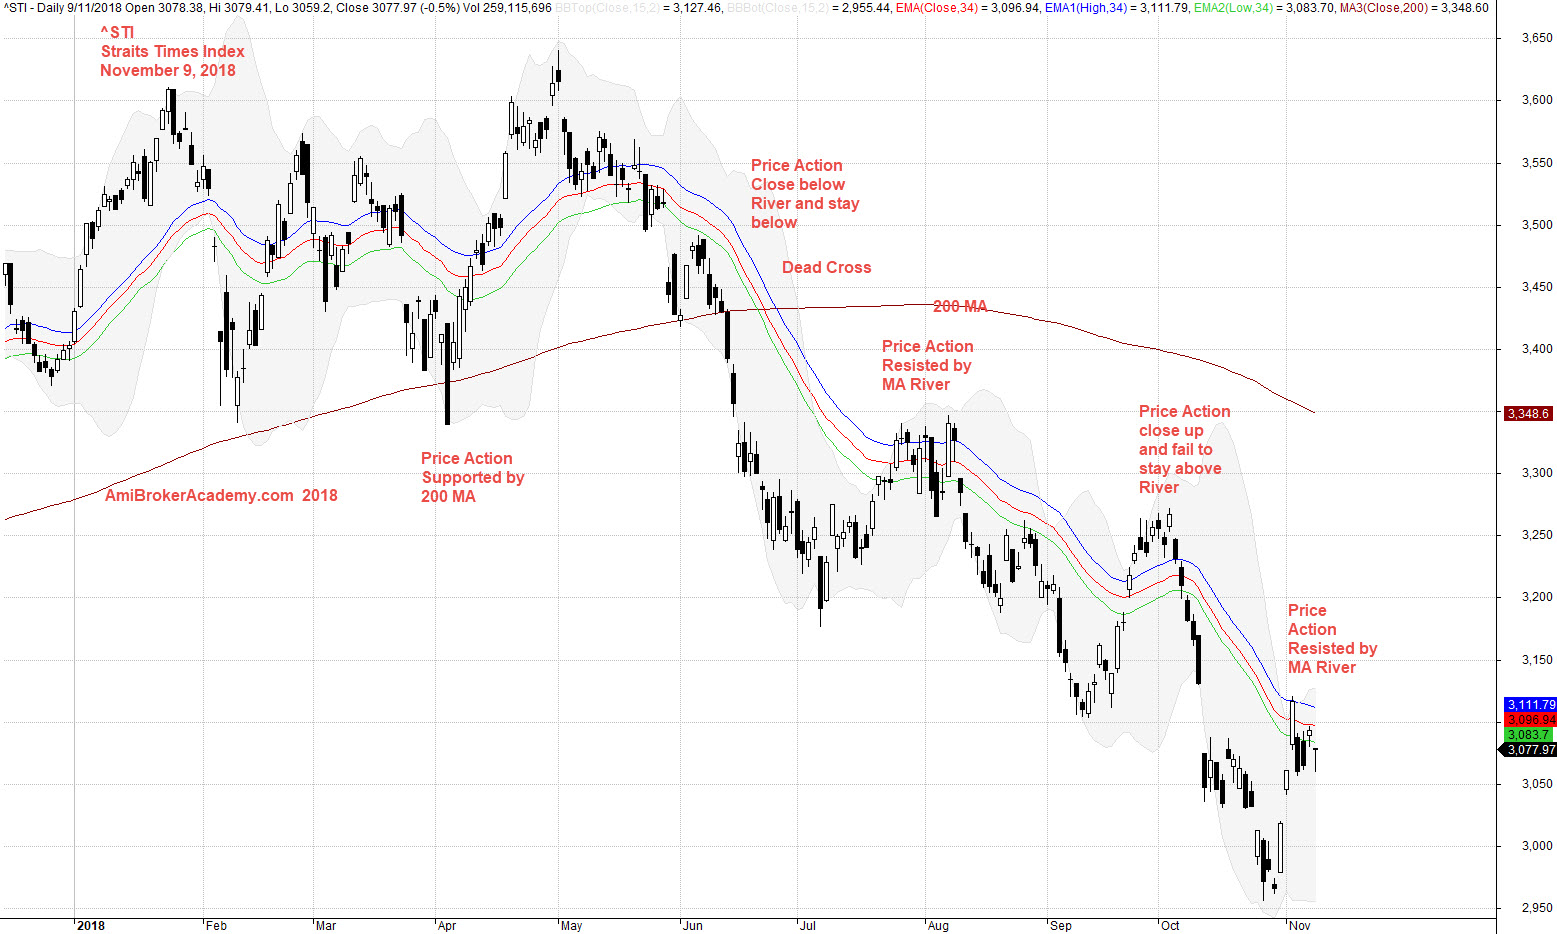
November 9, 2018 Straits Times Index and River
Add MACD indicator, see chart.
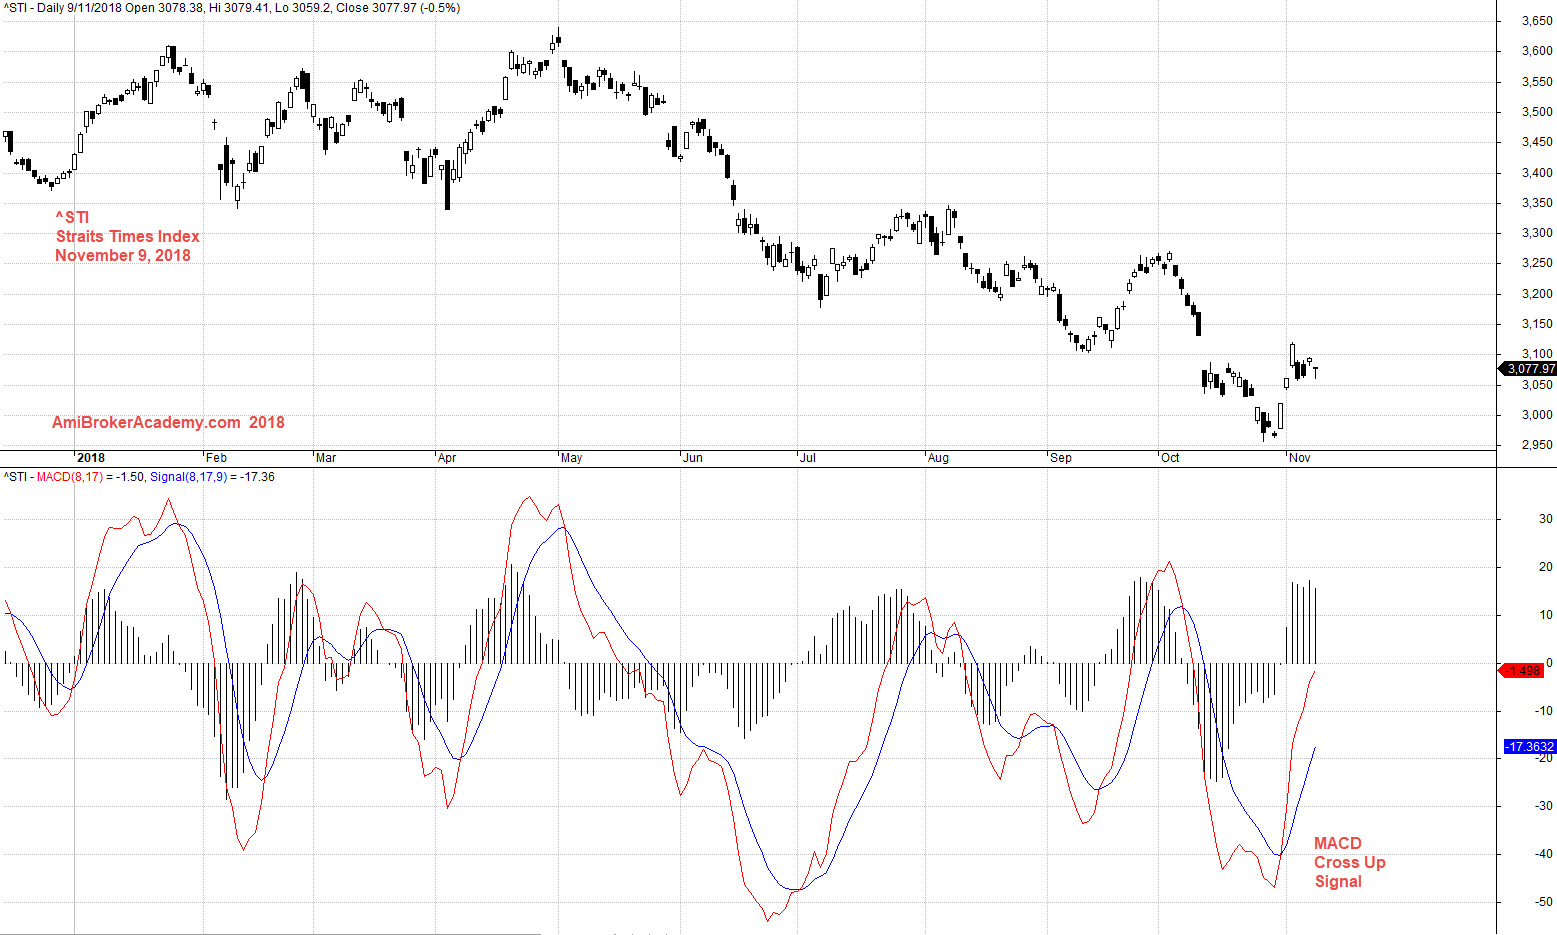
November 9, 2018 Straits Times Index and MACD
Moses
AmiBrokerAcademy.com
Disclaimer
The above result is for illustration purpose. It is not meant to be used for buy or sell decision. We do not recommend any particular stocks. If particular stocks of such are mentioned, they are meant as demonstration of Amibroker as a powerful charting software and MACD. Amibroker can program to scan the stocks for buy and sell signals.
These are script generated signals. Not all scan results are shown here. The MACD signal should use with price action. Users must understand what MACD and price action are all about before using them. If necessary you should attend a course to learn more on Technical Analysis (TA) and Moving Average Convergence Divergence, MACD.
Once again, the website does not guarantee any results or investment return based on the information and instruction you have read here. It should be used as learning aids only and if you decide to trade real money, all trading decision should be your own.