July 1, 2019
Welcome to AmiBrokerAcademy.com.
G13 Genting Singapore Stock Chart and Bollinger Bands
Study Genting Singapore stock price with Bollinger bands.
See the illustration and remarks, trade with eyes open.
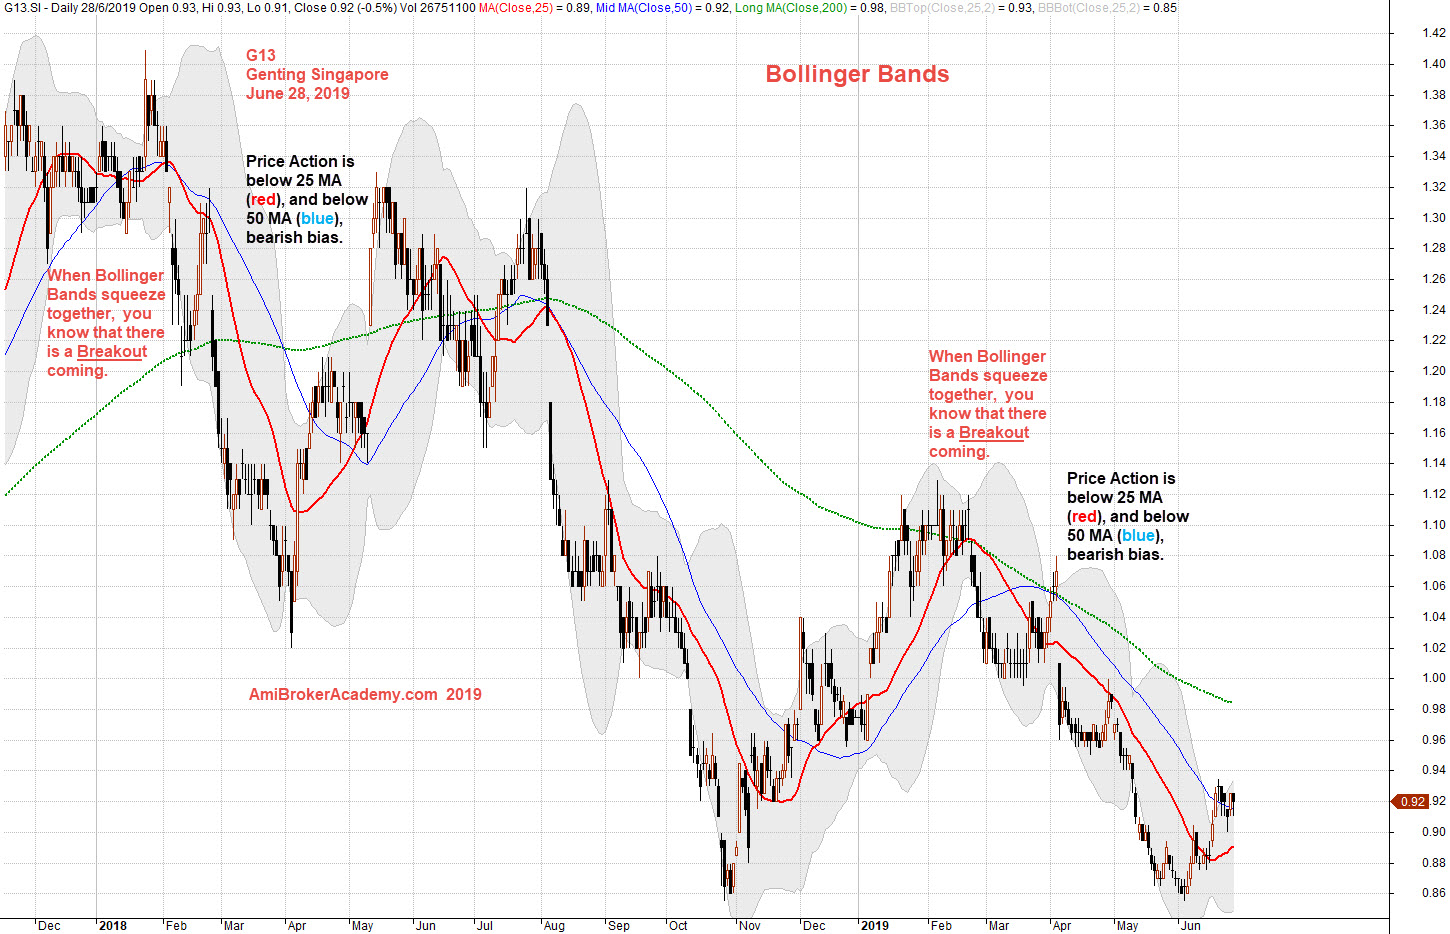
Bollinger Bands Indicator
In case you are not familiar with Bollinter Bands. Bollinger Bands are created by John Bollinger in the early 1980s. It is a technical analysis tool. John explain that Bollinger Bands came from Wilfrid Ledoux’s idea in 1960, where Wilfrid used curves connecting the monthly highs and lows of the Dow Jones Industrial Average as a long-term market-timing tool.
Bollinger Bands are curves drawn in and around the price structure usually consisting of a moving average in the middle, an upper band, and a lower band.
Moses Stock Observation
AmiBrokerAcademy.com
Disclaimer
The above result is for illustration purpose. It is not meant to be used for buy or sell decision. We do not recommend any particular stocks. If particular stocks of such are mentioned, they are meant as demonstration of Amibroker as a powerful charting software and MACD. Amibroker can program to scan the stocks for buy and sell signals.
These are script generated signals. Not all scan results are shown here. The MACD signal should use with price action. Users must understand what MACD and price action are all about before using them. If necessary you should attend a course to learn more on Technical Analysis (TA) and Moving Average Convergence Divergence, MACD.
Once again, the website does not guarantee any results or investment return based on the information and instruction you have read here. It should be used as learning aids only and if you decide to trade real money, all trading decision should be your own.