November 18, 2018
Thanks for visiting the site.
There is a reason for everything. Perhaps at the moment you do not have the answer.
Moses Stock Analysis
S41 Hong Leong Finance Stock Charting
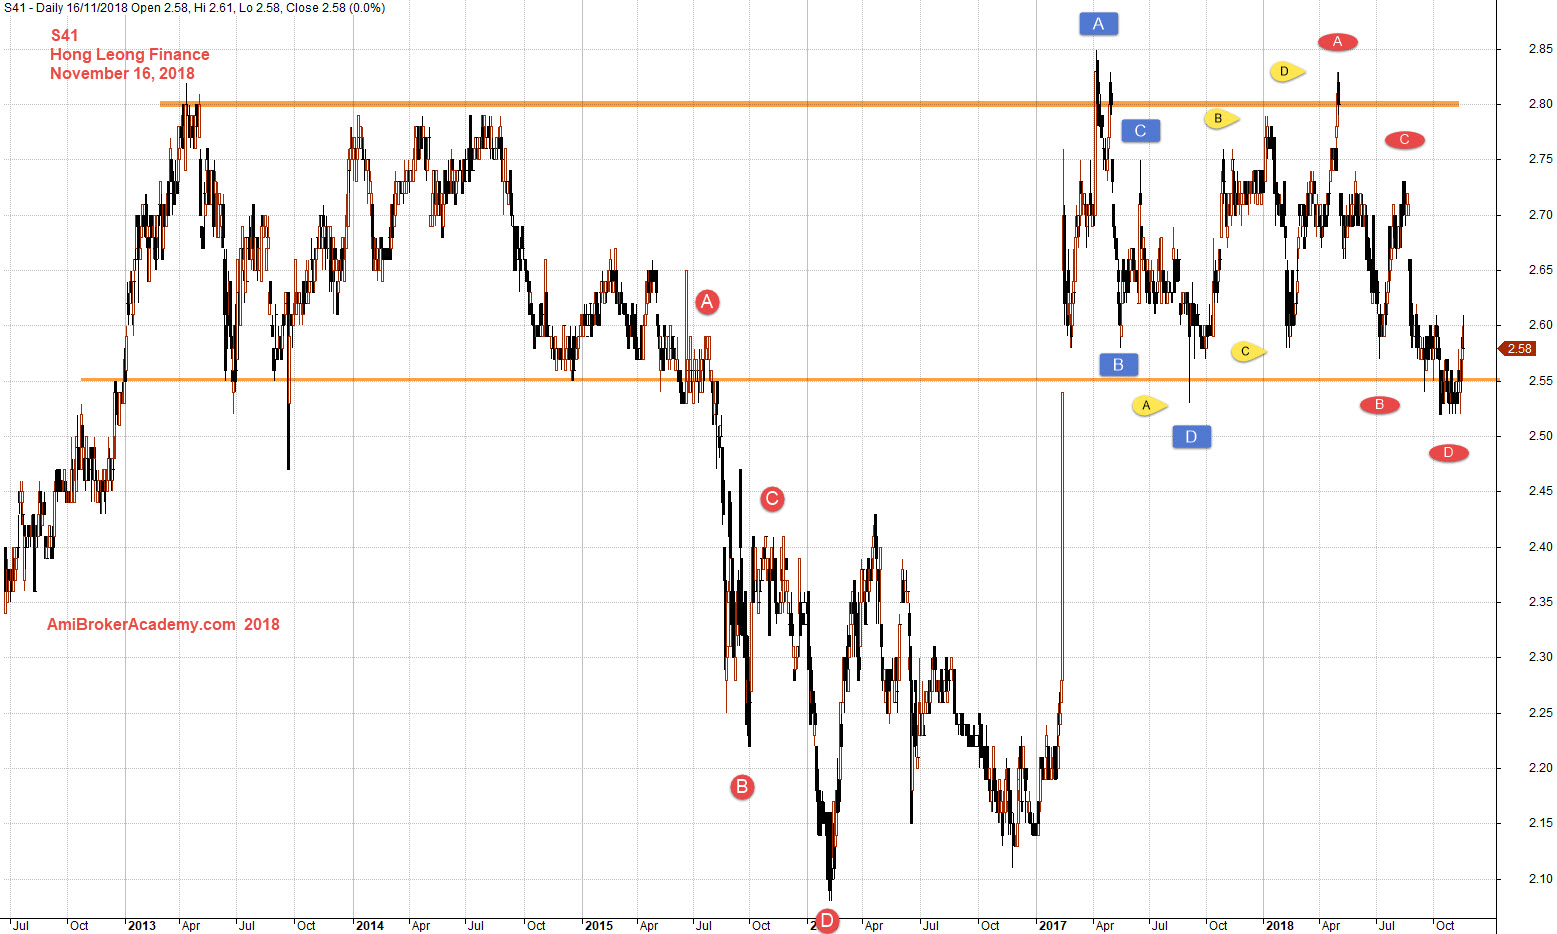
Buy low sell high, buy support sell resistance.
See chart, the price action of Hong Leong Finance stock chart.
Apply buy low sell high and buy hold strategy. The price action test 2.80 dollars and again before a big pullback to send the price action to below 2.10 dollars. You could spot the H M Gartley 222 pattern. The price action than gain strength to retest the 2.80 dollars level and breakout higher to 2.85 dollars. The price drift south follow the ABCD pattern to the low of 2.55 dollars. Apparently 2.55 is an important level, see chart. The price action retest near 2.55 region again recently.
So, for the BHS, buy hold strategy it is quite hard to trade. See chart.
Trade with eyes open, manage your risk.
November 16, 2018 Hong Leong Finance Chartings
Add the moving averages, high low and close using 34 period. We call the band river. See chart, picture worth a thousand words. The river after fail to cross below slow ma, the fast ma test to cross down again. Finally, the dead cross succeed, the price action now below slow MA. Trade with your eyes open.
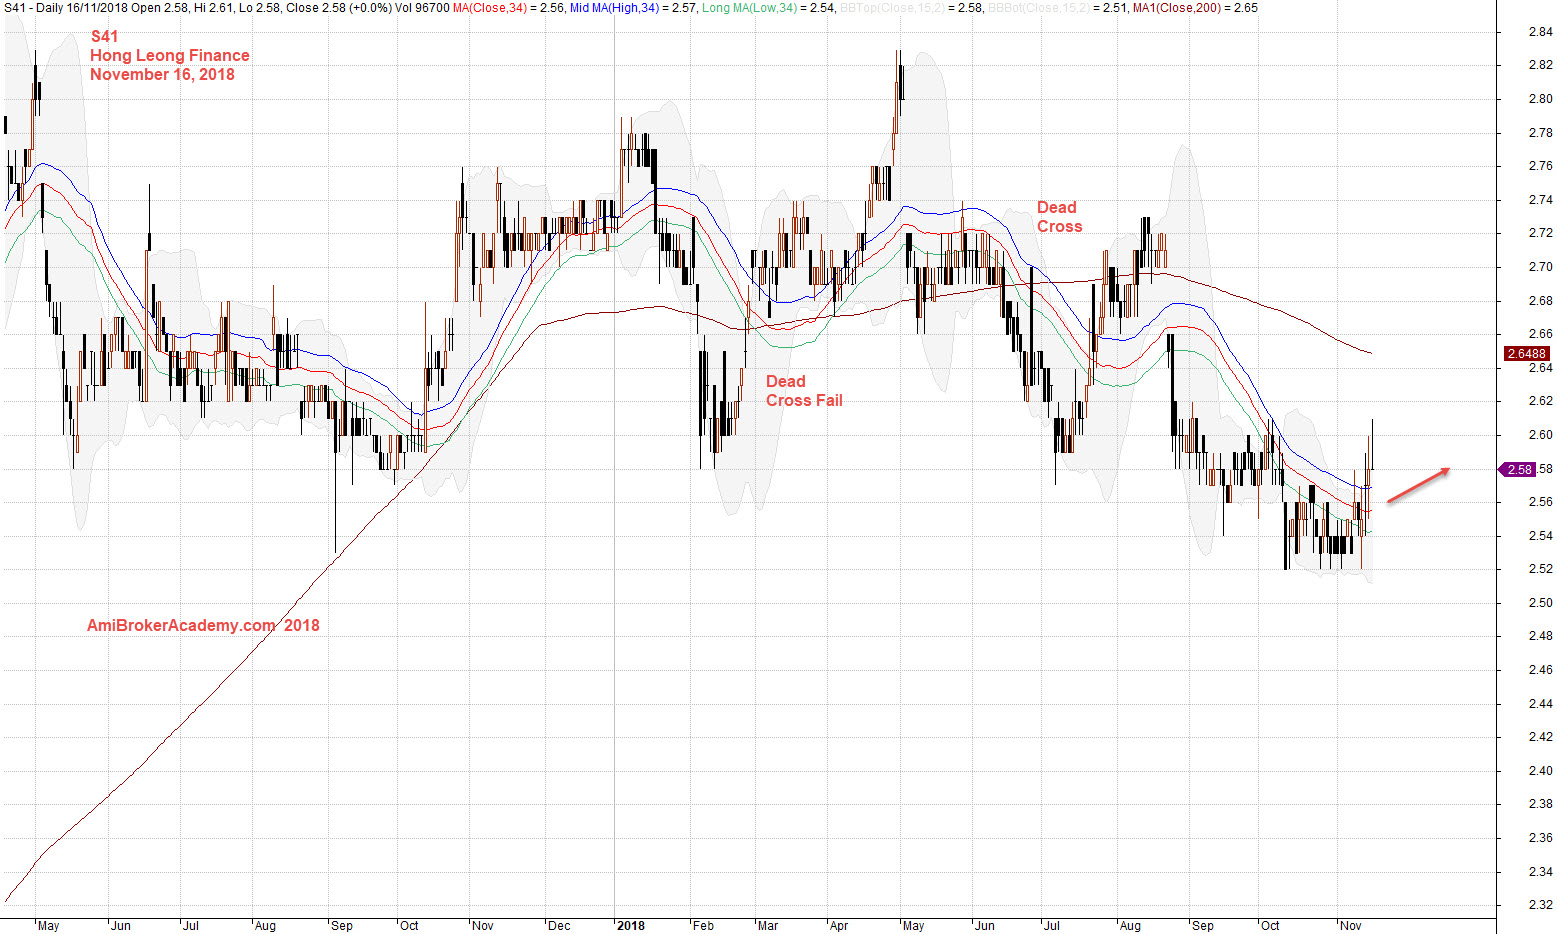
November 16, 2018 Hong Leong Finance and River
Add MACD indicator, see chart.
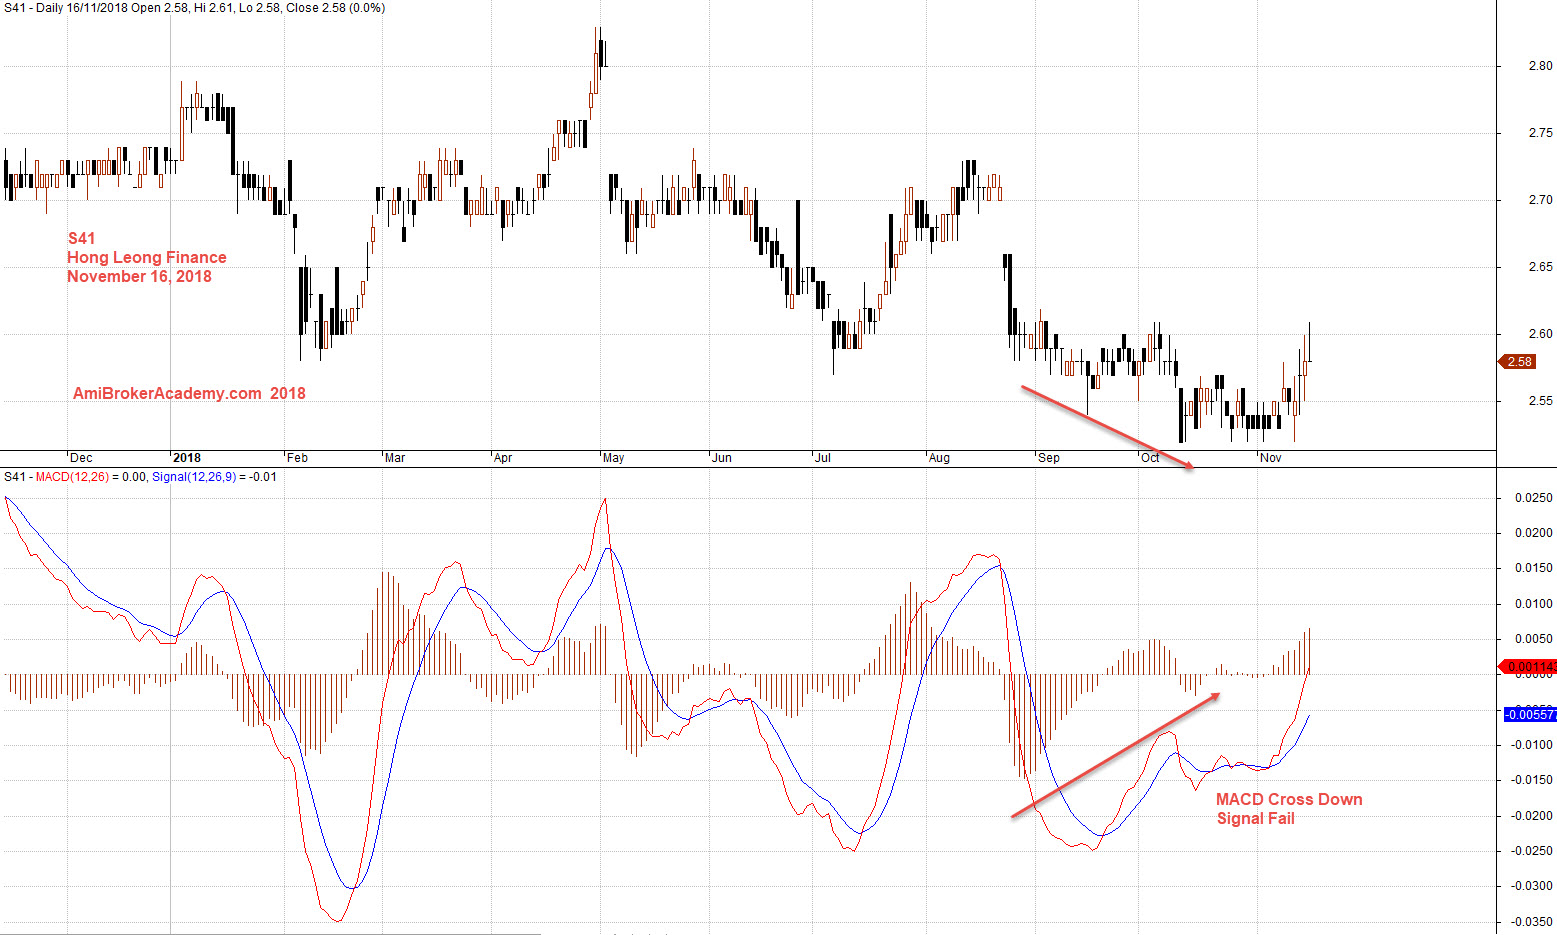
November 16, 2018 Hong Leong Finance and MACD
Moses
AmiBrokerAcademy.com
Disclaimer
The above result is for illustration purpose. It is not meant to be used for buy or sell decision. We do not recommend any particular stocks. If particular stocks of such are mentioned, they are meant as demonstration of Amibroker as a powerful charting software and MACD. Amibroker can program to scan the stocks for buy and sell signals.
These are script generated signals. Not all scan results are shown here. The MACD signal should use with price action. Users must understand what MACD and price action are all about before using them. If necessary you should attend a course to learn more on Technical Analysis (TA) and Moving Average Convergence Divergence, MACD.
Once again, the website does not guarantee any results or investment return based on the information and instruction you have read here. It should be used as learning aids only and if you decide to trade real money, all trading decision should be your own.