6 October, 2018
Thanks for visiting the site.
Free U.S. Stock MACD Scan
What is MACD?
MACD stands for Moving Average Convergence Divergence, common setting is (12,26,9)
MACD indicator is a trend trading system that makes up of 2 lines. The MACD Line (fast line) and MACD Signal Line (slow line).
1) When the MACD Line crosses over the MACD Signal Line the trend is bullish. When the MACD Line crosses below the MACD Signal the trend is bearish.
2) When the MACD Line crosses above zero line the trend is bullish. When the MACD line crosses below zero line the trend is bearish.
October 5 2018 – Script Generated One-day U.S. Stock MACD Signals
The following are script generated One-day U.S. Stock Market MACD signals using the Powerful AmiBroker’s AFL.
The MACD Setting used is (8,17,9)
| Ticker | Company | Date | Signals | Close | Vol.(K) | Screening Result |
| FE | FirstEnergy Corporation | 5/10/2018 | Bullish | 37.98 | 5334 | MACD Cross-Up ZeroLine |
| FITB | Fifth Third Bancorp | 5/10/2018 | Bullish | 28.27 | 3861 | MACD Cross-Up Signal |
| GIS | General Mills, Inc. | 5/10/2018 | Bullish | 43.49 | 4341 | MACD Cross-Up Signal |
| GPS | Gap, Inc. (The) | 5/10/2018 | Bullish | 27.59 | 4010 | MACD +ve Divergence |
| M | Macy’s Inc | 5/10/2018 | Bullish | 32.83 | 9013 | MACD-H +ve Divergence |
| MO | Altria Group | 5/10/2018 | Bullish | 62.07 | 7177 | MACD Cross-Up Signal |
| PEG | Public Service Enterprise Group Incorporated | 5/10/2018 | Bullish | 52.71 | 3472 | MACD Cross-Up ZeroLine |
| PPL | PPL Corporation | 5/10/2018 | Bullish | 30.29 | 5237 | MACD Cross-Up ZeroLine |
| SGH | SMART Global Holdings, Inc. | 5/10/2018 | Bullish | 34.15 | 7272 | MACD Cross-Up Signal |
| SIR | Select Income REIT | 5/10/2018 | Bullish | 20.03 | 6104 | MACD +ve Divergence |
| TSN | Tyson Foods, Inc. | 5/10/2018 | Bullish | 61.55 | 3077 | MACD Cross-Up Signal |
| DISCK | Discovery Communications, Inc. | 5/10/2018 | Bearish | 30.24 | 3193 | MACD-H -ve Divergence |
| DISH | DISH Network Corporation | 5/10/2018 | Bearish | 34.3 | 3583 | MACD Cross-Down ZeroLine |
| EMB | iShares J.P. Morgan USD Emerging Markets Bond ETF | 5/10/2018 | Bearish | 105.84 | 10612 | MACD Cross-Down ZeroLine |
| EMR | Emerson Electric Company | 5/10/2018 | Bearish | 78.06 | 4115 | MACD -ve Divergence |
| ERI | Eldorado Resorts, Inc. | 5/10/2018 | Bearish | 44.55 | 3087 | MACD Cross-Down Signal |
| HPQ | HP Inc. | 5/10/2018 | Bearish | 25.34 | 15682 | MACD-H -ve Divergence |
| IBM | International Business Machines Corporation | 5/10/2018 | Bearish | 149.03 | 4602 | MACD Cross-Down Signal |
| KMI-PA | Kinder Morgan, Inc. | 5/10/2018 | Bearish | 33.97 | 3888 | MACD -ve Divergence |
| LB | L Brands, Inc. | 5/10/2018 | Bearish | 28.46 | 5556 | MACD Cross-Down ZeroLine |
| LOW | Lowe’s Companies, Inc. | 5/10/2018 | Bearish | 109.74 | 5277 | MACD Cross-Down ZeroLine |
| MLCO | Melco Resorts & Entertainment Limited | 5/10/2018 | Bearish | 19.82 | 6678 | MACD Cross-Down Signal |
| MOS | Mosaic Company (The) | 5/10/2018 | Bearish | 33.11 | 4127 | MACD-H -ve Divergence |
| MRVL | Marvell Technology Group Ltd. | 5/10/2018 | Bearish | 18.6 | 10235 | MACD Cross-Down ZeroLine |
| NVDA | NVIDIA Corporation | 5/10/2018 | Bearish | 269.86 | 10655 | MACD Cross-Down Signal |
| PENN | Penn National Gaming, Inc. | 5/10/2018 | Bearish | 30.04 | 5095 | MACD Cross-Down Signal |
| QQQ | PowerShares QQQ Trust, Series 1 | 5/10/2018 | Bearish | 180.15 | 83309 | MACD Cross-Down ZeroLine |
| SGMS | Scientific Games Corp | 5/10/2018 | Bearish | 23.28 | 3119 | MACD Cross-Down Signal |
| SYMC | Symantec Corporation | 5/10/2018 | Bearish | 20.04 | 7390 | MACD Cross-Down ZeroLine |
| T | AT&T Inc. | 5/10/2018 | Bearish | 33.99 | 28666 | MACD-H -ve Divergence |
| TQQQ | ProShares UltraPro QQQ | 5/10/2018 | Bearish | 64.75 | 16596 | MACD Cross-Down ZeroLine |
| TXN | Texas Instruments Incorporated | 5/10/2018 | Bearish | 103.28 | 8772 | MACD Cross-Down Signal |
| UAA | Under Armour, Inc. | 5/10/2018 | Bearish | 19.42 | 4308 | MACD Cross-Down ZeroLine |
| WDC | Western Digital Corporation | 5/10/2018 | Bearish | 56.15 | 3960 | MACD Cross-Down Signal |
| WLL | Whiting Petroleum Corporation | 5/10/2018 | Bearish | 48.26 | 4132 | MACD Cross-Down Signal |
| XLNX | Xilinx, Inc. | 5/10/2018 | Bearish | 77.9 | 4511 | MACD Cross-Down Signal |
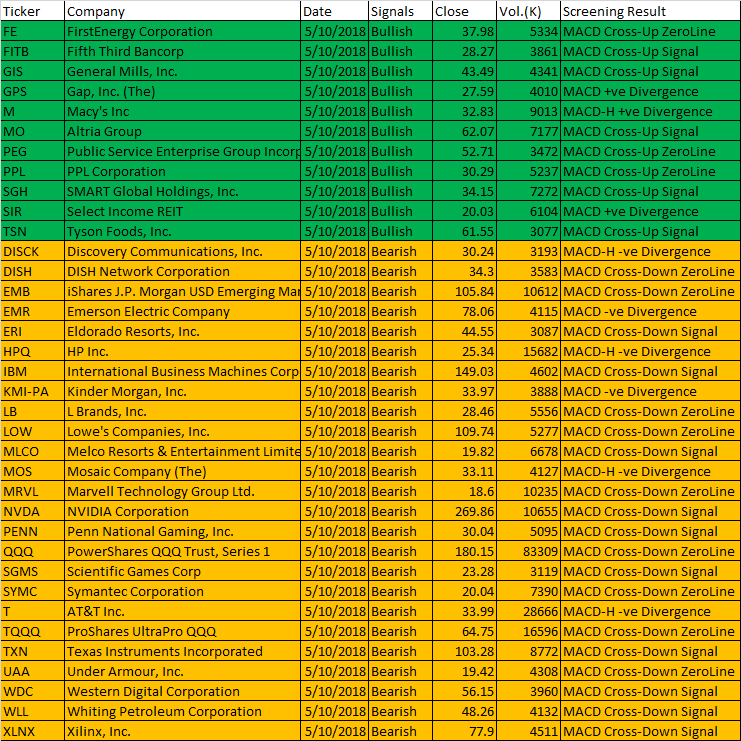
October 5, 2018 US Stock One-day MACD Screener Results
Moses U.S. Stock MACD Scan
AmiBroker Academy.com
Disclaimer
The above result is for illustration purpose. It is not meant to be used for buy or sell decision. We do not recommend any particular stocks. If particular stocks of such are mentioned, they are meant as demonstration of Amibroker as a powerful charting software and MACD. Amibroker can program to scan the stocks for buy and sell signals.
These are script generated signals. Not all scan results are shown here. The MACD signal should use with price action. Users must understand what MACD and price action are all about before using them. If necessary you should attend a course to learn more on Technical Analysis (TA) and Moving Average Convergence Divergence, MACD.
Once again, the website does not guarantee any results or investment return based on the information and instruction you have read here. It should be used as learning aids only and if you decide to trade real money, all trading decision should be your own.