13 December 2018
Thanks for visiting the site.
Hong Kong Stock 香港股 Analysis
0992.HK Hong Kong Stock 香港股 Lenovo Group 联想集团 Stock Charting
Trade with your eyes open. Manage your trade.
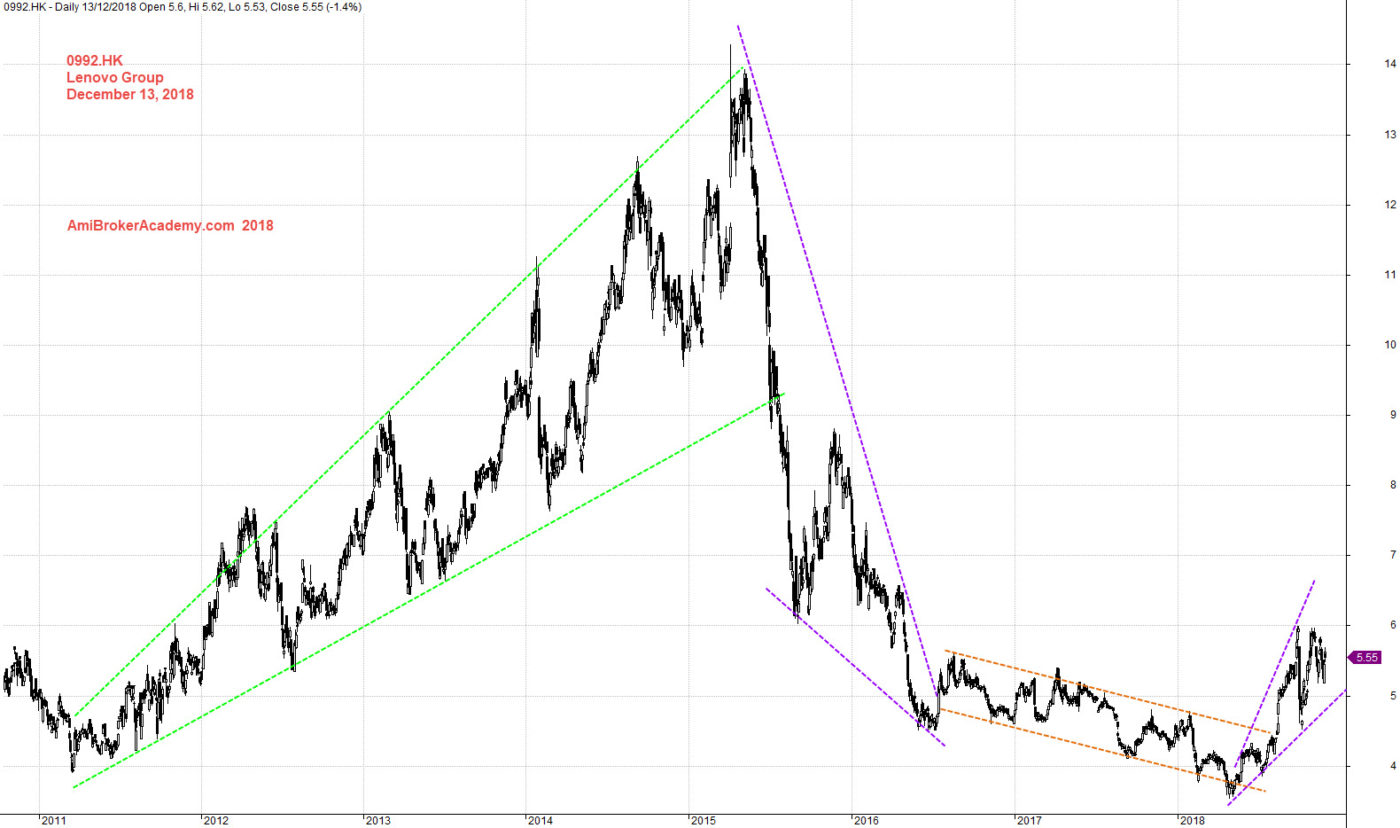
联想 Lenovo stock price goes from 4 Hong Kong Dollars to the high of 14 Hong Kong Dollars in four years. But the stock price also goes from the high of HK$ 14 to below HK$ 4 in three years.
Are you the kind of applying BHS, Buy and Hold Strategy investor? After nearly eight years of holding, you are back to the square one. So, trade with your eyes open. Be flexible in your trading strategy.
Check out the line added to the chart, what if you take profit when the trend change, may be you will make money.
Remember, the reason you trade is because you want to make money.
See chart, when the price goes high and higher, there is always a possibility of topping. So this is maybe some of the stocks now in USA, United State of America. Many of the stock might be topping.
You could check out some of the stock analysis here on our website. Have fun!
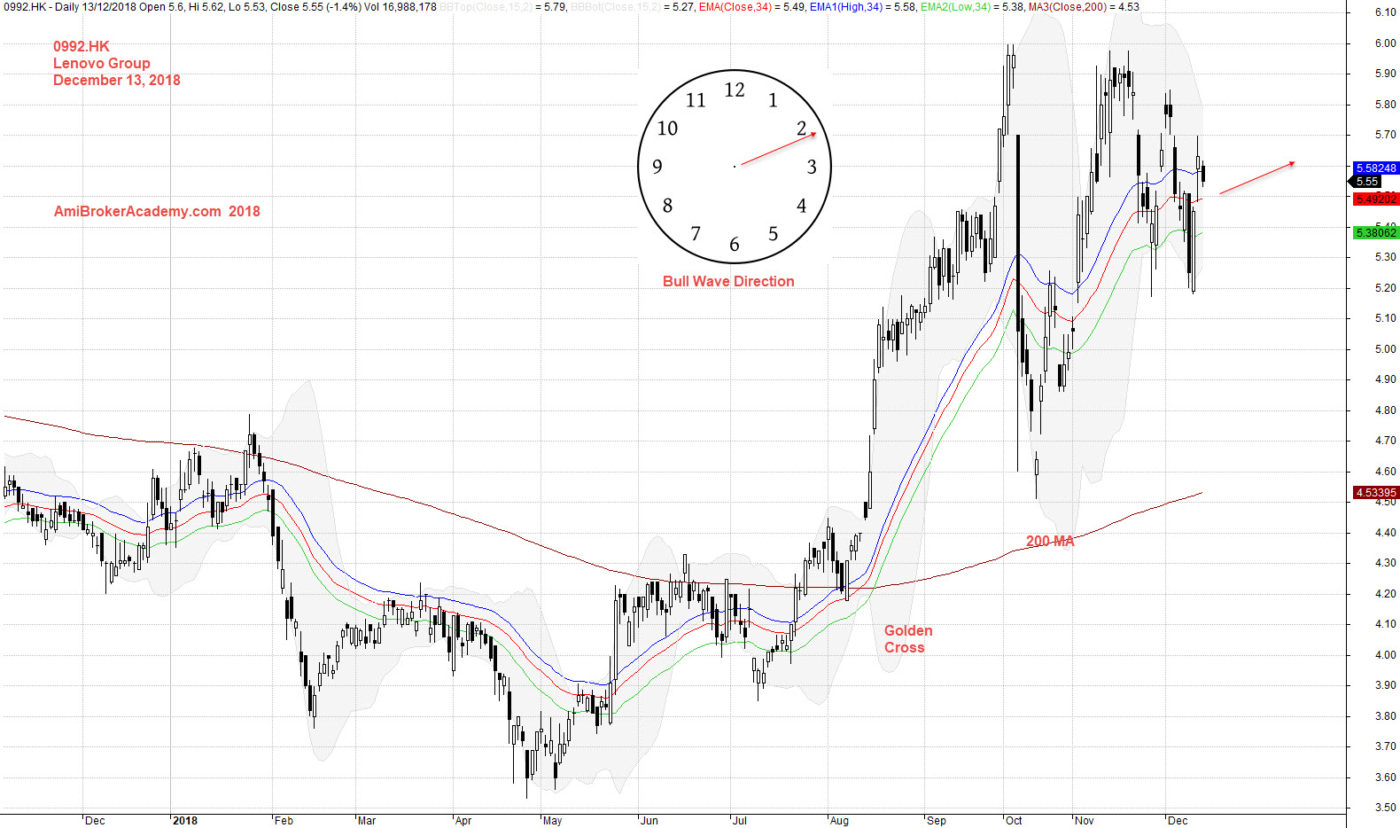
Moving Average is a great visual tool, we add 34 period, high low and close MA. We could see a band, we may call it river. We see the river flow up. The price action was above River, then goes below River, then goes above again. We also see the River slopping down or flow down, flat, sideways, and slopping up, flow up again.
Moses
AmiBrokerAcademy.com
Disclaimer
The above result is for illustration purpose. It is not meant to be used for buy or sell decision. We do not recommend any particular stocks. If particular stocks of such are mentioned, they are meant as demonstration of Amibroker as a powerful charting software and MACD. Amibroker can program to scan the stocks for buy and sell signals.
These are script generated signals. Not all scan results are shown here. The MACD signal should use with price action. Users must understand what MACD and price action are all about before using them. If necessary you should attend a course to learn more on Technical Analysis (TA) and Moving Average Convergence Divergence, MACD.
Once again, the website does not guarantee any results or investment return based on the information and instruction you have read here. It should be used as learning aids only and if you decide to trade real money, all trading decision should be your own.