August 2, 2014
Moses’ Free Stock MACD Screening Results for July 30, 2014 Singapore Stocks
Welcome to Moses’s Stock Column at AmiBrokerAcademy.com. Thank you for visiting the site. One of the reasons you are here because you want to know which stocks will move.
Lesson
Divergence Trading Strategy
When price action is making higher high, oscillator indicator should also be making higher high. Or when price action is making lower low, oscillator indicator should also be making lower low.
Oscillator indicators refer to MACD, Stochastic, RSI, CCI and any indicators that move back and forth between two points such as zero (0) and one hundred (100).
Divergence happens when they are not, that means the price action and the oscillator is diverging from the other.
Divergence can be used to trade trend reversal and trend continuation. How can this be achieved? Be patience, will show you how.
Trend Reversal and Trend Continuation
There are two types of divergence, Regular Divergence to signal trend reversal and Hidden Divergence to signal trend continuation.
Divergence or Regular Divergence trading strategy is a trading strategy to spot weakening in trend, or in other words the sign of reversal of the price action, the trend momentum. Bullish Divergence when the price action is forming lower low, but the oscillator like MACD is forming higher low. Or Bearish Divergence when the price action is forming a higher high, but the MACD is forming a lower high.
Hidden Divergence is used to spot for trend continuation. Bearish Hidden Divergence when price action is forming a lower high but the MACD is forming a higher high. Or Bullish Hidden Divergence when the price action is forming a higher low, but the MACD is forming a lower low.
Confirmation
Remember, all set up can fail, the rule of the game never believe a word until you see the confirmation such as trendline break. It is just like traffic light. You don’t stop at the traffic light always unless it is red. So, wait for confirmation. Confirmation helps in reduce your risk.
Free MACD Scan
This site provides you the free MACD scan for Singapore stocks.
This is July 30, 2014, Wednesday Singapore stocks that have the following MACD signals, which have trading volume greater than 500,000 shares.
Total 76 stocks have MACD bullish and bearish signals, of which only 39 stocks are traded more than 500,000 shares. Only 8 stocks have bullish MACD signals, and 31 stocks have bearish MACD signals. Wow! Bulls are out of town again.
- MACD line crosses above MACD signal – Bullish trend
- MACD line crosses above zero line – Bullish trend
- MACD Histogram +ve Divergence – Bullish trend
- MACD line crosses below MACD signal – Bearish trend
- MACD line crosses below zero line – Bearish trend
- MACD Histogram -ve Divergence – Bearish trend
- Volume traded greater 500,000 shares
| Ticker | Company | Signals | Close | Vol.(K) | Screening Result |
| 5DM | YING LI INTL REAL ESTATE LTD | Bullish | 0.26 | 7759 | MACD Cross-Up Signal |
| 558 | UMS HOLDINGS LIMITED | Bullish | 0.575 | 5120 | MACD Cross-Up ZeroLine |
| D5IU | LIPPO MALLS INDO RETAIL TRUST | Bullish | 0.41 | 3143 | MACD Cross-Up Signal |
| S7OU | ASIAN PAY TELEVISION TRUST | Bullish | 0.84 | 2425 | MACD Cross-Up Signal |
| J7X | TIGER AIRWAYS HOLDINGS LIMITED | Bullish | 0.435 | 2133 | MACD-H +ve Divergence |
| D4N | CHINA NEW TOWN DEVT CO LIMITED | Bullish | 0.073 | 1628 | MACD Cross-Up Signal |
| NO4 | DYNA-MAC HOLDINGS LTD. | Bullish | 0.39 | 802 | MACD Cross-Up Signal |
| 554 | KING WAN CORPORATION LIMITED | Bullish | 0.35 | 519 | MACD Cross-Up Signal |
| 5RA | ASIA-PACIFIC STRATEGIC INV LTD | Bearish | 0.057 | 75518 | MACD Cross-Down Signal |
| J10 | JAYA HOLDINGS LTD | Bearish | 0.066 | 55433 | MACD Cross-Down Signal |
| 5G9 | TRITECH GROUP LIMITED | Bearish | 0.235 | 17356 | MACD Cross-Down Signal |
| 5DE | EMS ENERGY LIMITED | Bearish | 0.067 | 16597 | MACD Cross-Down Signal |
| 5ET | ASIASONS CAPITAL LIMITED | Bearish | 0.051 | 15603 | MACD Cross-Down Signal |
| C52 | COMFORTDELGRO CORPORATION LTD | Bearish | 2.56 | 5196 | MACD Cross-Down Signal |
| A6F | UNIONMET (SINGAPORE) LIMITED | Bearish | 0.059 | 4859 | MACD Cross-Down ZeroLine |
| RW0U | MAPLETREE GREATER CHINACOMM TR | Bearish | 0.915 | 4016 | MACD-H -ve Divergence |
| A31 | ADDVALUE TECHNOLOGIES LTD | Bearish | 0.114 | 3622 | MACD Cross-Down Signal |
| T09 | TT INTERNATIONAL LIMITED | Bearish | 0.171 | 3279 | MACD Cross-Down Signal |
| S63 | SINGAPORE TECH ENGINEERING LTD | Bearish | 3.77 | 3008 | MACD Cross-Down ZeroLine |
| 5G2 | KIMHENG OFFSHORE&MARINE HLDLTD | Bearish | 0.26 | 2718 | MACD Cross-Down ZeroLine |
| A53 | A-SONIC AEROSPACE LIMITED | Bearish | 0.088 | 1941 | MACD Cross-Down Signal |
| K71U | KEPPEL REIT | Bearish | 1.27 | 1848 | MACD Cross-Down ZeroLine |
| P11 | PACIFIC ANDES RESOURCES DEVLTD | Bearish | 0.121 | 1841 | MACD Cross-Down ZeroLine |
| RF1U | RELIGARE HEALTH TRUST | Bearish | 0.93 | 1840 | MACD-H -ve Divergence |
| ME8U | MAPLETREE INDUSTRIAL TRUST | Bearish | 1.415 | 1776 | MACD Cross-Down ZeroLine |
| 544 | CSE GLOBAL LTD | Bearish | 0.73 | 1541 | MACD-H -ve Divergence |
| S58 | SATS LTD. | Bearish | 3.04 | 1465 | MACD Cross-Down ZeroLine |
| H07 | STAMFORD LAND CORPORATION LTD | Bearish | 0.64 | 1446 | MACD-H -ve Divergence |
| 546 | MEDTECS INTERNATIONAL CORP LTD | Bearish | 0.071 | 1155 | MACD Cross-Down Signal |
| ER0 | KSH HOLDINGS LIMITED | Bearish | 0.545 | 1018 | MACD Cross-Down Signal |
| 5FI | ORIENTAL GROUP LTD. | Bearish | 0.1 | 850 | MACD Cross-Down Signal |
| C11 | CEI CONTRACT MANUFACTURING LTD | Bearish | 0.099 | 779 | MACD Cross-Down ZeroLine |
| B1ZU | RICKMERS MARITIME | Bearish | 0.295 | 740 | MACD Cross-Down Signal |
| U96 | SEMBCORP INDUSTRIES LTD | Bearish | 5.48 | 709 | MACD Cross-Down Signal |
| J37 | JARDINE STRATEGIC HLDGS LTD | Bearish | 35.81 | 691 | MACD Cross-Down Signal |
| A7RU | CITYSPRING INFRASTRUCT TRUST | Bearish | 0.495 | 629 | MACD Cross-Down Signal |
| T4B | SINO GRANDNESS FOOD IND GP LTD | Bearish | 0.675 | 573 | MACD Cross-Down Signal |
| DU4 | MERMAID MARITIME PUBLIC CO LTD | Bearish | 0.435 | 564 | MACD Cross-Down Signal |
| P15 | PACIFIC CENTURY REGIONAL DEVTS | Bearish | 0.255 | 508 | MACD Cross-Down Signal |
Straits Times Index
July 30, 2014, Straits Times Index, STI closed at 3353.65 points, STI closed down 2.43 points from the last closed at 3356.08 points.
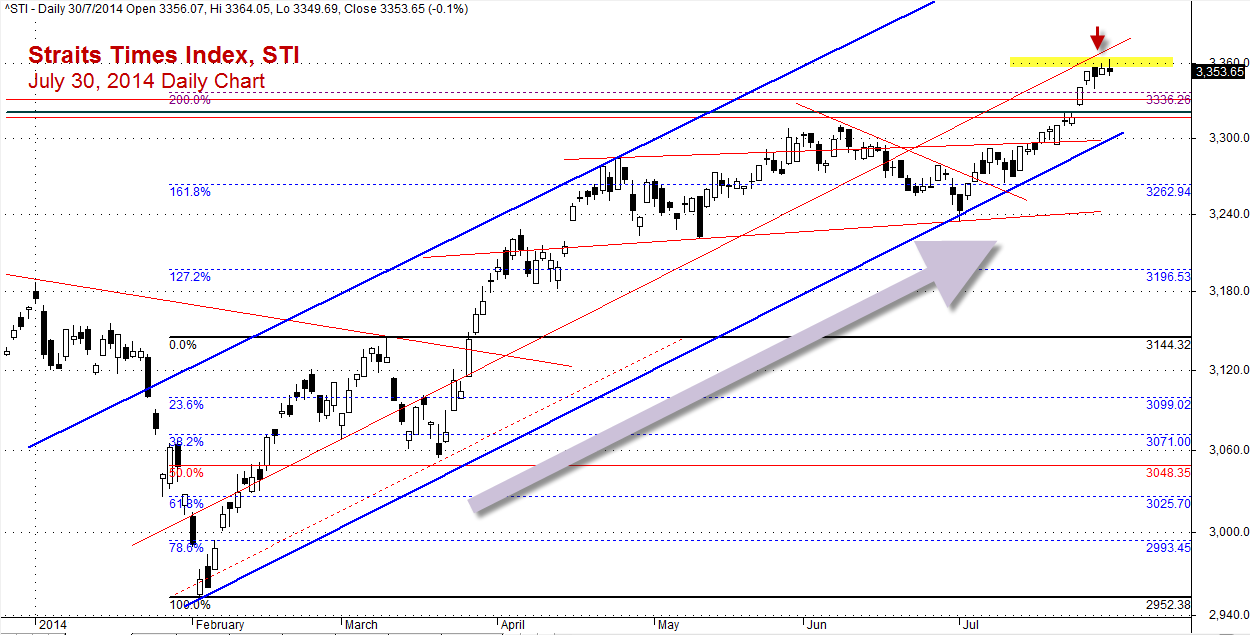
Straits Times Index, STI July 30, 2014 Daily Chart
Thanks for visiting the site, AmiBrokerAcademy.com.
Moses
DISCLAIMER
Information provided here is of the nature of a general comment only and no intend to be specific for trading advice. It has prepared without regard to any particular investment objectives, financial situation or needs. Information should not be considered as an offer or enticement to buy, sell or trade.
You should seek advice from your broker, or licensed investment advisor, before taking any action.
Once again, the website does not guarantee any results or investment return based on the information and instruction you have read here. It should be used as learning aids only and if you decide to trade real money, all trading decision should be your own.