July 27, 2014
Moses’ Free Stock MACD Screening Results for July 18, 2014 Singapore Stocks
Welcome to Moses’s Stock Column at AmiBrokerAcademy.com. Thank you for visiting the site. One of the reasons you are here because you want to know which stocks will move.
Find a Stock that Might Move is Not Very Different from a Fishing Trip
One way to find a stock might move can use eyeball the chart. It’s no different from eyeball the pond to find where the fishes are located.
A better way to find where the fishes are could use Side-scan sonar, a wave scanner. In stock trading, a convenient way to find a potential stock that might move is MACD Scan.
There are over 900 hundred stocks listed on Singapore Stock Exchange, SGX. MACD scan can help you to narrow down to less than a few stocks (with criteria such as top traded volume, stock price, and so on).
This site provides you the free MACD scan for Singapore stocks.
However, MACD signal is just like thunder and lightning. It warns that might be
raining (the stock might move). It is wise to see raindrops (price action) to confirm that it is raining.
Free MACD Scan
The site here provides Singapore stocks scan that has MACD bullish signal or bearish signal.
This is July 18, 2014 Singapore stocks that have the following MACD signals, which have trading volume greater than 500,000 shares.
Total 67 stocks have above MACD bullish and bearish signals, of which only 30 stocks are traded more than 500,000 shares. Only 9 stocks have bullish MACD signals, and 21 stocks have bearish MACD signals.
- MACD line crosses above MACD signal – Bullish trend
- MACD line crosses above zero line – Bullish trend
- MACD Histogram +ve Divergence – Bullish trend
- MACD line crosses below MACD signal – Bearish trend
- MACD line crosses below zero line – Bearish trend
- MACD Histogram -ve Divergence – Bearish trend
- Volume traded greater 500,000 shares
| Ticker | Company | Signals | Close | Vol.(K) | Screening Result |
| 545 | VALLIANZ HOLDINGS LIMITED | Bullish | 0.134 | 18861 | MACD Cross-Up Signal |
| 5DM | YING LI INTL REAL ESTATE LTD | Bullish | 0.26 | 8299 | MACD-H +ve Divergence |
| A17U | ASCENDAS REAL ESTATE INV TRUST | Bullish | 2.33 | 8222 | MACD Cross-Up ZeroLine |
| KI3 | HU AN CABLE HOLDINGS LTD. | Bullish | 0.076 | 6504 | MACD Cross-Up Signal |
| A78 | LIONGOLD CORP LTD | Bullish | 0.079 | 5923 | MACD Cross-Up Signal |
| F34 | WILMAR INTERNATIONAL LIMITED | Bullish | 3.21 | 5718 | MACD Cross-Up ZeroLine |
| QF6 | SWEE HONG LIMITED | Bullish | 0.355 | 1990 | MACD Cross-Up Signal |
| 5HH | SINJIA LAND LIMITED | Bullish | 0.205 | 537 | MACD Cross-Up Signal |
| MT1 | DRAGON GROUP INTL LIMITED | Bullish | 0.079 | 535 | MACD Cross-Up Signal |
| 5EN | MIDAS HLDGS LIMITED | Bearish | 0.435 | 5792 | MACD Cross-Down Signal |
| C52 | COMFORTDELGRO CORPORATION LTD | Bearish | 2.56 | 5518 | MACD -ve Divergence |
| 5WH | REX INTERNATIONAL HOLDING LTD | Bearish | 0.635 | 4629 | MACD Cross-Down Signal |
| 5OC | KOYO INTERNATIONAL LIMITED | Bearish | 0.142 | 4511 | MACD Cross-Down Signal |
| A26 | SINARMAS LAND LIMITED | Bearish | 0.63 | 3411 | MACD Cross-Down Signal |
| KJ9 | COGENT HOLDINGS LIMITED | Bearish | 0.455 | 2140 | MACD Cross-Down Signal |
| NR7 | RAFFLES EDUCATION CORP LTD | Bearish | 0.38 | 1612 | MACD Cross-Down Signal |
| F31 | FRAGRANCE GROUP LIMITED | Bearish | 0.24 | 1527 | MACD Cross-Down Signal |
| 544 | CSE GLOBAL LTD | Bearish | 0.695 | 1511 | MACD-H -ve Divergence |
| S53 | SMRT CORPORATION LTD | Bearish | 1.605 | 1265 | MACD Cross-Down Signal |
| T8V | PACIFIC RADIANCE LTD. | Bearish | 1.43 | 1218 | MACD Cross-Down Signal |
| U19 | UNITED ENVIROTECH LTD | Bearish | 1.405 | 1151 | MACD Cross-Down ZeroLine |
| K01 | K1 VENTURES LIMITED | Bearish | 0.2 | 1081 | MACD Cross-Down Signal |
| U11 | UNITED OVERSEAS BANK LTD | Bearish | 23.65 | 1052 | MACD Cross-Down Signal |
| S21 | GENTING HONG KONG LIMITED | Bearish | 0.385 | 996 | MACD Cross-Down Signal |
| P9J | GLOBAL PREMIUM HOTELS LIMITED | Bearish | 0.38 | 853 | MACD Cross-Down Signal |
| ND8U | FRASERS COMMERCIAL TRUST | Bearish | 1.405 | 709 | MACD-H -ve Divergence |
| 526 | HG METAL MANUFACTURING LTD | Bearish | 0.083 | 679 | MACD Cross-Down Signal |
| D5IU | LIPPO MALLS INDO RETAIL TRUST | Bearish | 0.405 | 649 | MACD Cross-Down Signal |
| OV8 | SHENG SIONG GROUP LTD | Bearish | 0.665 | 596 | MACD -ve Divergence |
| C29 | CHIP ENG SENG CORPORATION LTD | Bearish | 0.805 | 510 | MACD-H -ve Divergence |
Straits Times Index
July 18, 2014, Friday, it was a great day to many. Another great Friday. Straits Times Index closed 3310.53 points. It is the highest for the entire 2014 so far. The bulls have wake up again. STI jumped 3.64 points from the last closed at 3306.89 points.
STI closed highest for July. But, from the MACD scan, there are only 9 stocks traded more than 500 K volume with bullish MACD signals.
Straits Times Index, STI July 18, 2014 Daily Chart
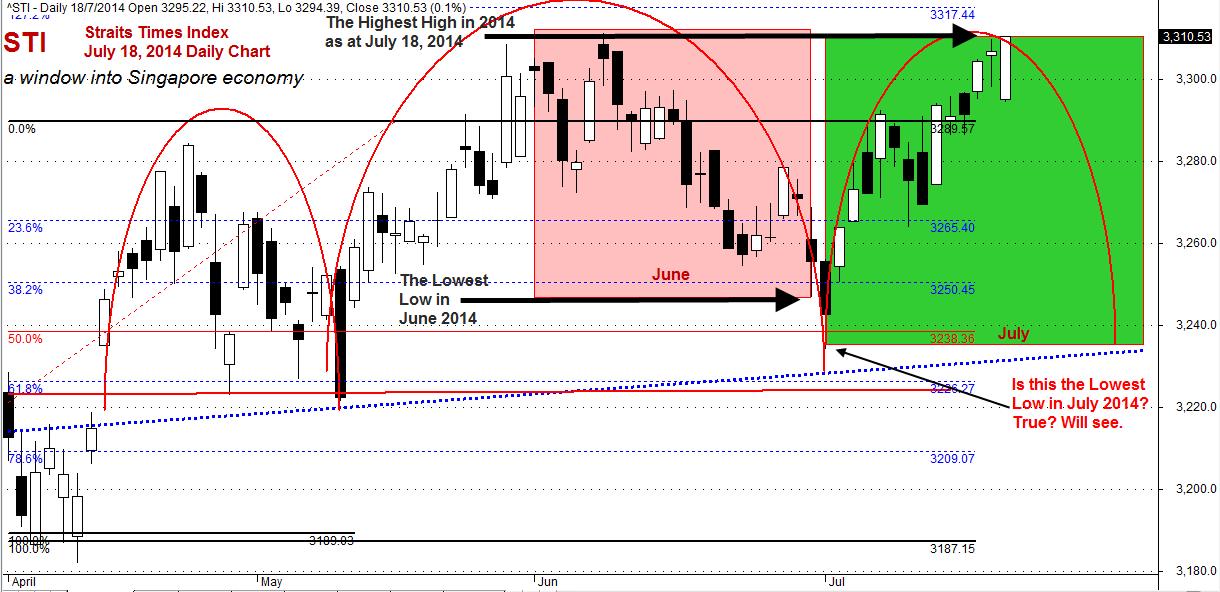
High and Low of June 2014. The High for 2014, July 18 Straits Times Index Daily Chart
Thanks for visiting the site, AmiBrokerAcademy.com.
Moses
DISCLAIMER
Information provided here is of the nature of a general comment only and no intend to be specific for trading advice. It has prepared without regard to any particular investment objectives, financial situation or needs. Information should not be considered as an offer or enticement to buy, sell or trade.
You should seek advice from your broker, or licensed investment advisor, before taking any action.
Once again, the website does not guarantee any results or investment return based on the information and instruction you have read here. It should be used as learning aids only and if you decide to trade real money, all trading decision should be your own.