July 27, 2014
Moses’ Free Stock MACD Screening Results for July 17, 2014 Singapore Stocks
Welcome to Moses’s Stock Column at AmiBrokerAcademy.com. Thank you for visiting the site. One of the reasons you are here because you want to know why the stock moves or which stocks will move in the near future.
How to Trade When You Find a Stock that Might Move?
Technical Analysis or chart analysis is after you have identified a stock, eyeball the chart and come out your own conclusions that will the stock move. It does not matter whether is a trend following trade or a counter trade. Only remember to do you money management and manage your risk.
You can use candlestick pattern to confirm your buy or sell conclusion. However, to protect your money, use stop loss to cut loss if the trend reverse.
Before you could practice the technical analysis and trade, you need to find a stock.
There are over 900 hundred stocks listed on Singapore Stock Exchange, SGX. With your diligent research, how many stocks could you study?
A convenience way to find a potential stock that might move, this site provides you the MACD scan.
However, MACD signal is just like thunder and lightning. It warns that might be
raining (the stock might move). It is wise to see raindrops (price action) to confirm that it is raining.
Free MACD Scan
The site here provides Singapore stocks scan that has MACD bullish signal or bearish signal.
This is July 17, 2014 Singapore stocks that have the following MACD signals, which have trading volume greater than 500,000 shares.
Total 68 stocks have above MACD bullish and bearish signals, of which only 37 stocks are traded more than 500,000 shares. Only 23 stocks have bullish MACD signals, and 14 stocks have bearish MACD signals.
- MACD line crosses above MACD signal – Bullish trend
- MACD line crosses above zero line – Bullish trend
- MACD Histogram +ve Divergence – Bullish trend
- MACD line crosses below MACD signal – Bearish trend
- MACD line crosses below zero line – Bearish trend
- MACD Histogram -ve Divergence – Bearish trend
- Volume traded greater 500,000 shares
| Ticker | Company | Signals | Close | Vol.(K) | Screening Result |
| 5WA | INTL HEALTHWAY CORP LIMITED | Bullish | 0.24 | 58120 | MACD Cross-Up Signal |
| 5DE | EMS ENERGY LIMITED | Bullish | 0.07 | 33232 | MACD Cross-Up Signal |
| N4E | NAM CHEONG LIMITED | Bullish | 0.465 | 22136 | MACD Cross-Up Signal |
| N21 | NOBLE GROUP LIMITED | Bullish | 1.415 | 18894 | MACD Cross-Up ZeroLine |
| F3V | SINO CONSTRUCTION LIMITED | Bullish | 0.27 | 9677 | MACD Cross-Up Signal |
| C38U | CAPITAMALL TRUST. | Bullish | 1.975 | 9401 | MACD Cross-Up ZeroLine |
| OU8 | CENTURION CORPORATION LIMITED | Bullish | 0.73 | 7576 | MACD Cross-Up ZeroLine |
| MS7 | VARD HOLDINGS LIMITED | Bullish | 1.09 | 5003 | MACD Cross-Up Signal |
| 5G1 | EUROSPORTS GLOBAL LIMITED | Bullish | 0.3 | 4394 | MACD Cross-Up Signal |
| P11 | PACIFIC ANDES RESOURCES DEVLTD | Bullish | 0.124 | 4222 | MACD Cross-Up ZeroLine |
| G05 | GOODPACK LIMITED. | Bullish | 2.4 | 3511 | MACD Cross-Up ZeroLine |
| M14 | INNOTEK LIMITED | Bullish | 0.37 | 3217 | MACD Cross-Up Signal |
| 566 | SEE HUP SENG LIMITED | Bullish | 0.29 | 2381 | MACD +ve Divergence |
| SV3U | SOILBUILD BUSINESS SPACE REIT | Bullish | 0.805 | 1975 | MACD Cross-Up Signal |
| S51 | SEMBCORP MARINE LTD | Bullish | 4.07 | 1785 | MACD Cross-Up ZeroLine |
| T39 | SINGAPORE PRESS HLDGS LTD | Bullish | 4.15 | 1399 | MACD-H +ve Divergence |
| AK3 | SWIBER HOLDINGS LIMITED | Bullish | 0.545 | 1247 | MACD-H +ve Divergence |
| S68 | SINGAPORE EXCHANGE LIMITED | Bullish | 6.97 | 1096 | MACD Cross-Up ZeroLine |
| ON7 | WEIYE HOLDINGS LIMITED | Bullish | 0.065 | 1004 | MACD-H +ve Divergence |
| B16 | GUOCOLEISURE LIMITED | Bullish | 1.13 | 976 | MACD Cross-Up ZeroLine |
| S21 | GENTING HONG KONG LIMITED | Bullish | 0.39 | 693 | MACD Cross-Up Signal |
| OV8 | SHENG SIONG GROUP LTD | Bullish | 0.67 | 675 | MACD Cross-Up Signal |
| KF4 | SIN HENG HEAVY MACHINERY LTD | Bullish | 0.215 | 649 | MACD Cross-Up Signal |
| 5RA | ASIA-PACIFIC STRATEGIC INV LTD | Bearish | 0.056 | 56237 | MACD Cross-Down ZeroLine |
| G13 | GENTING SINGAPORE PLC | Bearish | 1.325 | 8107 | MACD Cross-Down Signal |
| 5DX | METAL COMPONENT ENGG LTD | Bearish | 0.055 | 7040 | MACD Cross-Down Signal |
| T09 | TT INTERNATIONAL LIMITED | Bearish | 0.168 | 5955 | MACD Cross-Down Signal |
| M1GU | SABANA SHARI’AH COMPLIANT REIT | Bearish | 1.04 | 2773 | MACD Cross-Down Signal |
| 5HH | SINJIA LAND LIMITED | Bearish | 0.2 | 1828 | MACD Cross-Down Signal |
| I12 | IPC CORPORATION LIMITED | Bearish | 0.135 | 1636 | MACD Cross-Down Signal |
| 5H0 | SINGHAIYI GROUP LTD. | Bearish | 0.175 | 1384 | MACD Cross-Down Signal |
| 5VJ | HALCYON AGRI CORPORATION LTD | Bearish | 0.87 | 1168 | MACD Cross-Down ZeroLine |
| 5FL | FALCON ENERGY GROUP LIMITED | Bearish | 0.405 | 1115 | MACD -ve Divergence |
| B9R | CHINA XLX FERTILISER LTD. | Bearish | 0.4 | 1043 | MACD-H -ve Divergence |
| J85 | CDL HOSPITALITY TRUSTS | Bearish | 1.76 | 920 | MACD-H -ve Divergence |
| S69 | SERIAL SYSTEM LTD | Bearish | 0.139 | 591 | MACD Cross-Down Signal |
| 600 | HYFLUX LTD | Bearish | 1.18 | 571 | MACD Cross-Down Signal |
Straits Times Index
On July 17, 2014, Thursday the market confuse again, Straits Times Index closed at 3306.89 points. Formed a Doji candlestick. STI gapped up and ended 2.46 points higher from the last closed at 3304.43 points.
Straits Times Index Weekly Chart
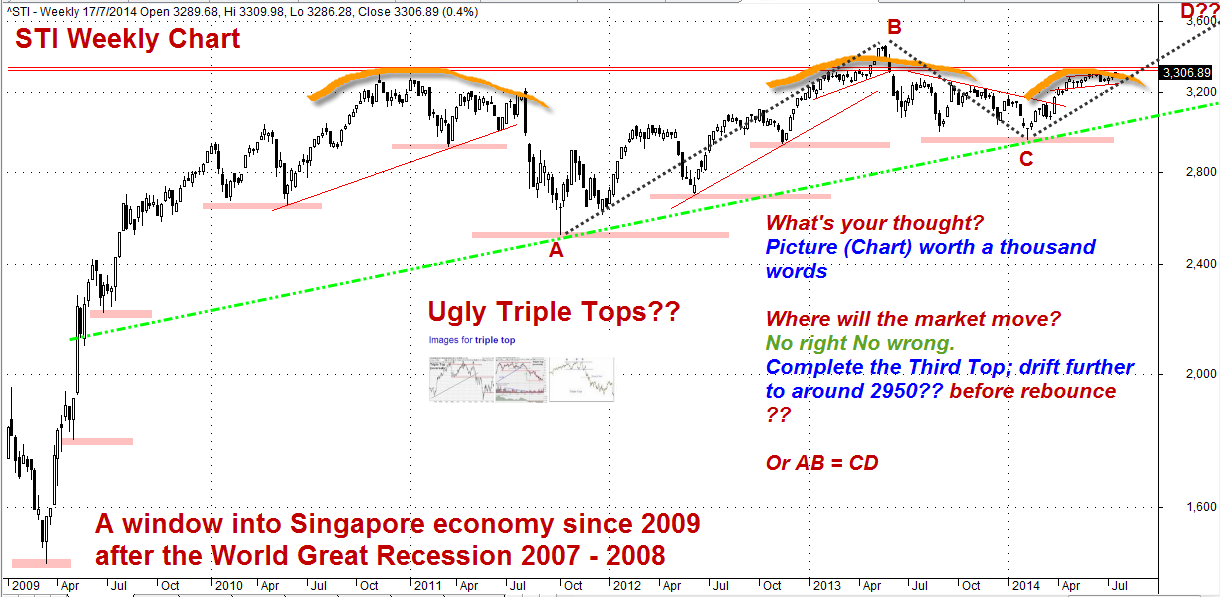
Straits Times Index, STI Weekly Chart after Great World Recession 2007 – 2008
Thanks for visiting the site, AmiBrokerAcademy.com.
Moses
DISCLAIMER
Information provided here is of the nature of a general comment only and no intend to be specific for trading advice. It has prepared without regard to any particular investment objectives, financial situation or needs. Information should not be considered as an offer or enticement to buy, sell or trade.
You should seek advice from your broker, or licensed investment advisor, before taking any action.
Once again, the website does not guarantee any results or investment return based on the information and instruction you have read here. It should be used as learning aids only and if you decide to trade real money, all trading decision should be your own.