16 November, 2018
Thanks for visiting the site.
Free U.S. Stock Five-day MACD Scan
Wht is AmiBroker AFL?
See the following link https://www.amibroker.com/guide/AFL.html on AmiBroker AFL.
What is MACD?
MACD stands for Moving Average Convergence Divergence, common setting is (12,26,9)
MACD indicator is a trend trading system that makes up of 2 lines. The MACD Line (fast line) and MACD Signal Line (slow line).
1) When the MACD Line crosses over the MACD Signal Line the trend is bullish. When the MACD Line crosses below the MACD Signal the trend is bearish.
2) When the MACD Line crosses above zero line the trend is bullish. When the MACD line crosses below zero line the trend is bearish.
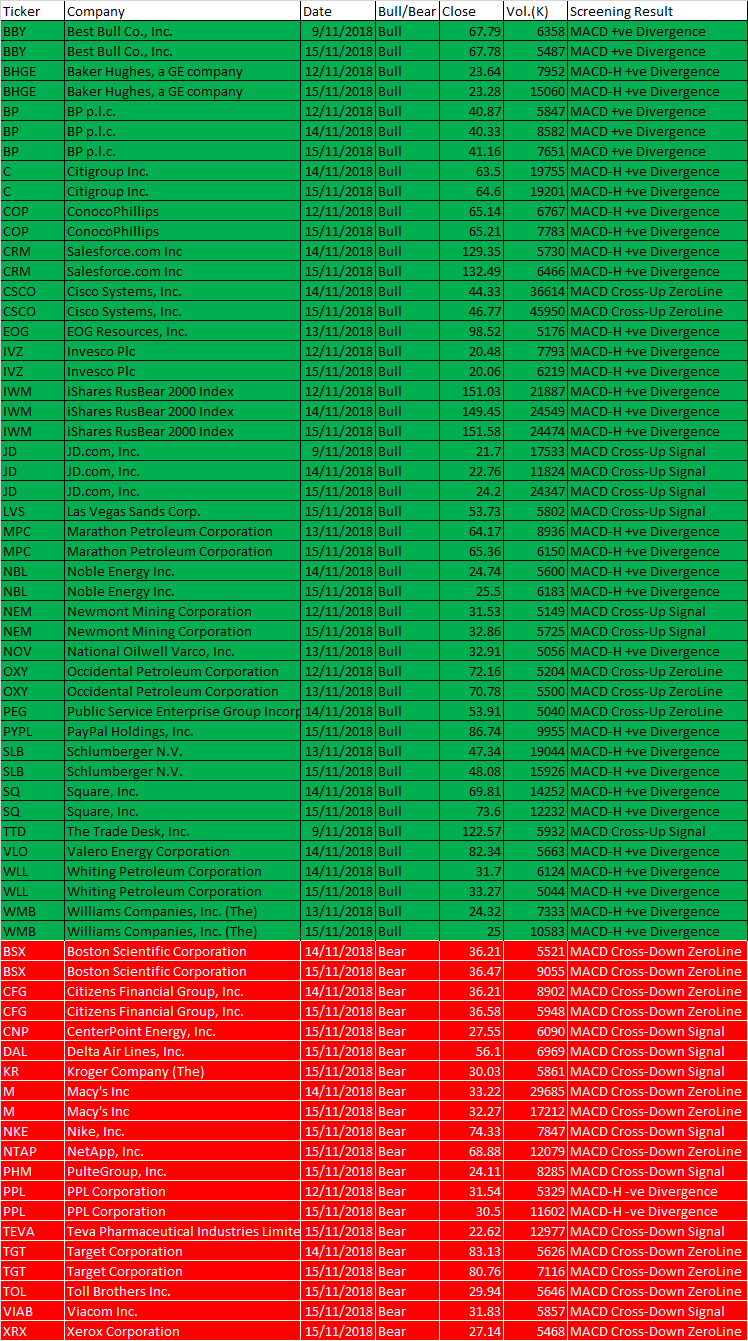
9 to 15 November 2018 AFL Script Generated Five-day U.S. Stock MACD Signals
The following are script generated Five-day U.S. Stock Market MACD signals using the Powerful AmiBroker’s AFL.
The MACD Setting used is (8,17,9)
| Ticker | Company | Date | Bull/Bear | Close | Vol.(K) | Screening Result |
| BBY | Best Bull Co., Inc. | 9/11/2018 | Bull | 67.79 | 6358 | MACD +ve Divergence |
| BBY | Best Bull Co., Inc. | 15/11/2018 | Bull | 67.78 | 5487 | MACD +ve Divergence |
| BHGE | Baker Hughes, a GE company | 12/11/2018 | Bull | 23.64 | 7952 | MACD-H +ve Divergence |
| BHGE | Baker Hughes, a GE company | 15/11/2018 | Bull | 23.28 | 15060 | MACD-H +ve Divergence |
| BP | BP p.l.c. | 12/11/2018 | Bull | 40.87 | 5847 | MACD +ve Divergence |
| BP | BP p.l.c. | 14/11/2018 | Bull | 40.33 | 8582 | MACD +ve Divergence |
| BP | BP p.l.c. | 15/11/2018 | Bull | 41.16 | 7651 | MACD +ve Divergence |
| C | Citigroup Inc. | 14/11/2018 | Bull | 63.5 | 19755 | MACD-H +ve Divergence |
| C | Citigroup Inc. | 15/11/2018 | Bull | 64.6 | 19201 | MACD-H +ve Divergence |
| COP | ConocoPhillips | 12/11/2018 | Bull | 65.14 | 6767 | MACD-H +ve Divergence |
| COP | ConocoPhillips | 15/11/2018 | Bull | 65.21 | 7783 | MACD-H +ve Divergence |
| CRM | Salesforce.com Inc | 14/11/2018 | Bull | 129.35 | 5730 | MACD-H +ve Divergence |
| CRM | Salesforce.com Inc | 15/11/2018 | Bull | 132.49 | 6466 | MACD-H +ve Divergence |
| CSCO | Cisco Systems, Inc. | 14/11/2018 | Bull | 44.33 | 36614 | MACD Cross-Up ZeroLine |
| CSCO | Cisco Systems, Inc. | 15/11/2018 | Bull | 46.77 | 45950 | MACD Cross-Up ZeroLine |
| EOG | EOG Resources, Inc. | 13/11/2018 | Bull | 98.52 | 5176 | MACD-H +ve Divergence |
| IVZ | Invesco Plc | 12/11/2018 | Bull | 20.48 | 7793 | MACD-H +ve Divergence |
| IVZ | Invesco Plc | 15/11/2018 | Bull | 20.06 | 6219 | MACD-H +ve Divergence |
| IWM | iShares RusBear 2000 Index | 12/11/2018 | Bull | 151.03 | 21887 | MACD-H +ve Divergence |
| IWM | iShares RusBear 2000 Index | 14/11/2018 | Bull | 149.45 | 24549 | MACD-H +ve Divergence |
| IWM | iShares RusBear 2000 Index | 15/11/2018 | Bull | 151.58 | 24474 | MACD-H +ve Divergence |
| JD | JD.com, Inc. | 9/11/2018 | Bull | 21.7 | 17533 | MACD Cross-Up Signal |
| JD | JD.com, Inc. | 14/11/2018 | Bull | 22.76 | 11824 | MACD Cross-Up Signal |
| JD | JD.com, Inc. | 15/11/2018 | Bull | 24.2 | 24347 | MACD Cross-Up Signal |
| LVS | Las Vegas Sands Corp. | 15/11/2018 | Bull | 53.73 | 5802 | MACD Cross-Up Signal |
| MPC | Marathon Petroleum Corporation | 13/11/2018 | Bull | 64.17 | 8936 | MACD-H +ve Divergence |
| MPC | Marathon Petroleum Corporation | 15/11/2018 | Bull | 65.36 | 6150 | MACD-H +ve Divergence |
| NBL | Noble Energy Inc. | 14/11/2018 | Bull | 24.74 | 5600 | MACD-H +ve Divergence |
| NBL | Noble Energy Inc. | 15/11/2018 | Bull | 25.5 | 6183 | MACD-H +ve Divergence |
| NEM | Newmont Mining Corporation | 12/11/2018 | Bull | 31.53 | 5149 | MACD Cross-Up Signal |
| NEM | Newmont Mining Corporation | 15/11/2018 | Bull | 32.86 | 5725 | MACD Cross-Up Signal |
| NOV | National Oilwell Varco, Inc. | 13/11/2018 | Bull | 32.91 | 5056 | MACD-H +ve Divergence |
| OXY | Occidental Petroleum Corporation | 12/11/2018 | Bull | 72.16 | 5204 | MACD Cross-Up ZeroLine |
| OXY | Occidental Petroleum Corporation | 13/11/2018 | Bull | 70.78 | 5500 | MACD Cross-Up ZeroLine |
| PEG | Public Service Enterprise Group Incorporated | 14/11/2018 | Bull | 53.91 | 5040 | MACD Cross-Up ZeroLine |
| PYPL | PayPal Holdings, Inc. | 15/11/2018 | Bull | 86.74 | 9955 | MACD-H +ve Divergence |
| SLB | Schlumberger N.V. | 13/11/2018 | Bull | 47.34 | 19044 | MACD-H +ve Divergence |
| SLB | Schlumberger N.V. | 15/11/2018 | Bull | 48.08 | 15926 | MACD-H +ve Divergence |
| SQ | Square, Inc. | 14/11/2018 | Bull | 69.81 | 14252 | MACD-H +ve Divergence |
| SQ | Square, Inc. | 15/11/2018 | Bull | 73.6 | 12232 | MACD-H +ve Divergence |
| TTD | The Trade Desk, Inc. | 9/11/2018 | Bull | 122.57 | 5932 | MACD Cross-Up Signal |
| VLO | Valero Energy Corporation | 14/11/2018 | Bull | 82.34 | 5663 | MACD-H +ve Divergence |
| WLL | Whiting Petroleum Corporation | 14/11/2018 | Bull | 31.7 | 6124 | MACD-H +ve Divergence |
| WLL | Whiting Petroleum Corporation | 15/11/2018 | Bull | 33.27 | 5044 | MACD-H +ve Divergence |
| WMB | Williams Companies, Inc. (The) | 13/11/2018 | Bull | 24.32 | 7333 | MACD-H +ve Divergence |
| WMB | Williams Companies, Inc. (The) | 15/11/2018 | Bull | 25 | 10583 | MACD-H +ve Divergence |
| BSX | Boston Scientific Corporation | 14/11/2018 | Bear | 36.21 | 5521 | MACD Cross-Down ZeroLine |
| BSX | Boston Scientific Corporation | 15/11/2018 | Bear | 36.47 | 9055 | MACD Cross-Down ZeroLine |
| CFG | Citizens Financial Group, Inc. | 14/11/2018 | Bear | 36.21 | 8902 | MACD Cross-Down ZeroLine |
| CFG | Citizens Financial Group, Inc. | 15/11/2018 | Bear | 36.58 | 5948 | MACD Cross-Down ZeroLine |
| CNP | CenterPoint Energy, Inc. | 15/11/2018 | Bear | 27.55 | 6090 | MACD Cross-Down Signal |
| DAL | Delta Air Lines, Inc. | 15/11/2018 | Bear | 56.1 | 6969 | MACD Cross-Down Signal |
| KR | Kroger Company (The) | 15/11/2018 | Bear | 30.03 | 5861 | MACD Cross-Down Signal |
| M | Macy’s Inc | 14/11/2018 | Bear | 33.22 | 29685 | MACD Cross-Down ZeroLine |
| M | Macy’s Inc | 15/11/2018 | Bear | 32.27 | 17212 | MACD Cross-Down ZeroLine |
| NKE | Nike, Inc. | 15/11/2018 | Bear | 74.33 | 7847 | MACD Cross-Down Signal |
| NTAP | NetApp, Inc. | 15/11/2018 | Bear | 68.88 | 12079 | MACD Cross-Down ZeroLine |
| PHM | PulteGroup, Inc. | 15/11/2018 | Bear | 24.11 | 8285 | MACD Cross-Down Signal |
| PPL | PPL Corporation | 12/11/2018 | Bear | 31.54 | 5329 | MACD-H -ve Divergence |
| PPL | PPL Corporation | 15/11/2018 | Bear | 30.5 | 11602 | MACD-H -ve Divergence |
| TEVA | Teva Pharmaceutical Industries Limited | 15/11/2018 | Bear | 22.62 | 12977 | MACD Cross-Down Signal |
| TGT | Target Corporation | 14/11/2018 | Bear | 83.13 | 5626 | MACD Cross-Down ZeroLine |
| TGT | Target Corporation | 15/11/2018 | Bear | 80.76 | 7116 | MACD Cross-Down ZeroLine |
| TOL | Toll Brothers Inc. | 15/11/2018 | Bear | 29.94 | 5646 | MACD Cross-Down ZeroLine |
| VIAB | Viacom Inc. | 15/11/2018 | Bear | 31.83 | 5857 | MACD Cross-Down Signal |
| XRX | Xerox Corporation | 15/11/2018 | Bear | 27.14 | 5468 | MACD Cross-Down ZeroLine |
if you can see the full chart, “press Ctrl and -” to zoom out and see the entire chart.
November 9 to 15, 2018 US Stock Five-day MACD Screener Signals
Moses U.S. Stock MACD Scan
AmiBroker Academy.com
Disclaimer
The above result is for illustration purpose. It is not meant to be used for buy or sell decision. We do not recommend any particular stocks. If particular stocks of such are mentioned, they are meant as demonstration of Amibroker as a powerful charting software and MACD. Amibroker can program to scan the stocks for buy and sell signals.
These are script generated signals. Not all scan results are shown here. The MACD signal should use with price action. Users must understand what MACD and price action are all about before using them. If necessary you should attend a course to learn more on Technical Analysis (TA) and Moving Average Convergence Divergence, MACD.
Once again, the website does not guarantee any results or investment return based on the information and instruction you have read here. It should be used as learning aids only and if you decide to trade real money, all trading decision should be your own.