9 March, 2020
Welcome!
Welcome to AmiBrokerAcademy.com. Thanks for visiting the site.
Have fun!
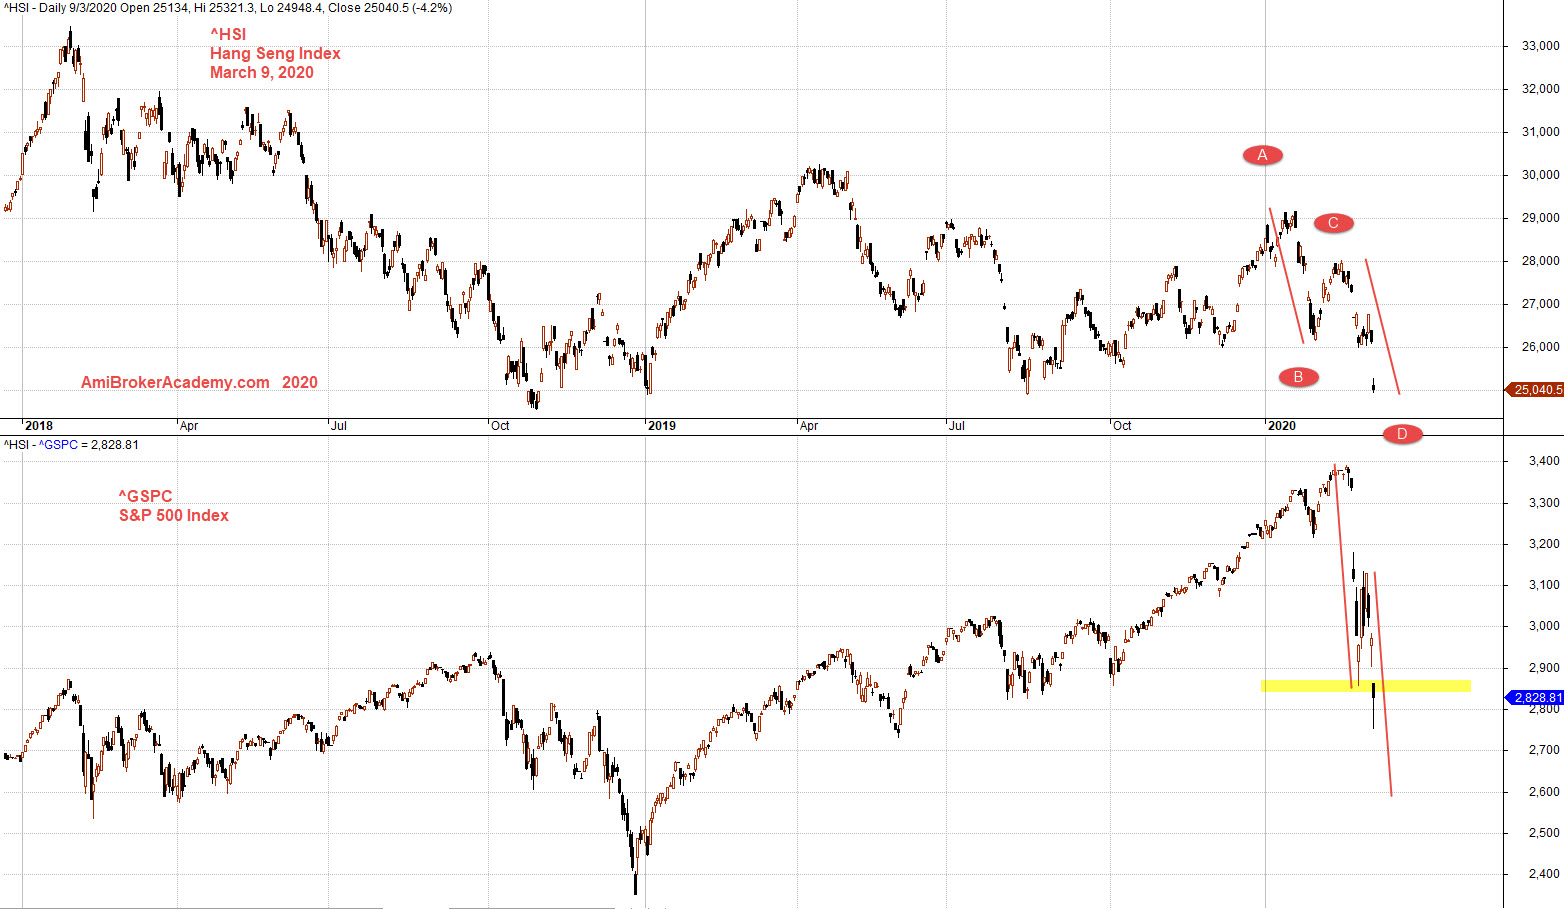
^HSI Hang Seng Index and ^DJI S&P 500 Index Correlation Charting
Study Hang Seng Index and S&P 500 Correlation stock chart price action and ABCD Pattern.
See chart, picture worth a thousand words.
Manage your expectation.
Remember to trade what you see and not what you think.
Manage your risk.
Also, to remember buy support and sell resistance.
There are many ways to find entry, one simple approach is using ABCD pattern. You try to take entry on each of the leg, such as AB leg, CD leg or BC leg.
For technical analyst, they have a crystal ball. They don’t really read news. They just focus on the the price action.
Moses Stock Observation
AmiBrokerAcademy.com
Disclaimer
The above result is for illustration purpose. It is not meant to be used for buy or sell decision. We do not recommend any particular stocks. If particular stocks of such are mentioned, they are meant as demonstration of Amibroker as a powerful charting software and MACD. Amibroker can program to scan the stocks for buy and sell signals.
These are script generated signals. Not all scan results are shown here. The MACD signal should use with price action. Users must understand what MACD and price action are all about before using them. If necessary you should attend a course to learn more on Technical Analysis (TA) and Moving Average Convergence Divergence, MACD.
Once again, the website does not guarantee any results or investment return based on the information and instruction you have read here. It should be used as learning aids only and if you decide to trade real money, all trading decision should be your own.