30 September, 2018
Thanks for visiting the site.
Free U.S. Stock Five-day MACD Scan
What is MACD?
MACD stands for Moving Average Convergence Divergence, common setting is (12,26,9)
MACD indicator is a trend trading system that makes up of 2 lines. The MACD Line (fast line) and MACD Signal Line (slow line).
1) When the MACD Line crosses over the MACD Signal Line the trend is bullish. When the MACD Line crosses below the MACD Signal the trend is bearish.
2) When the MACD Line crosses above zero line the trend is bullish. When the MACD line crosses below zero line the trend is bearish.
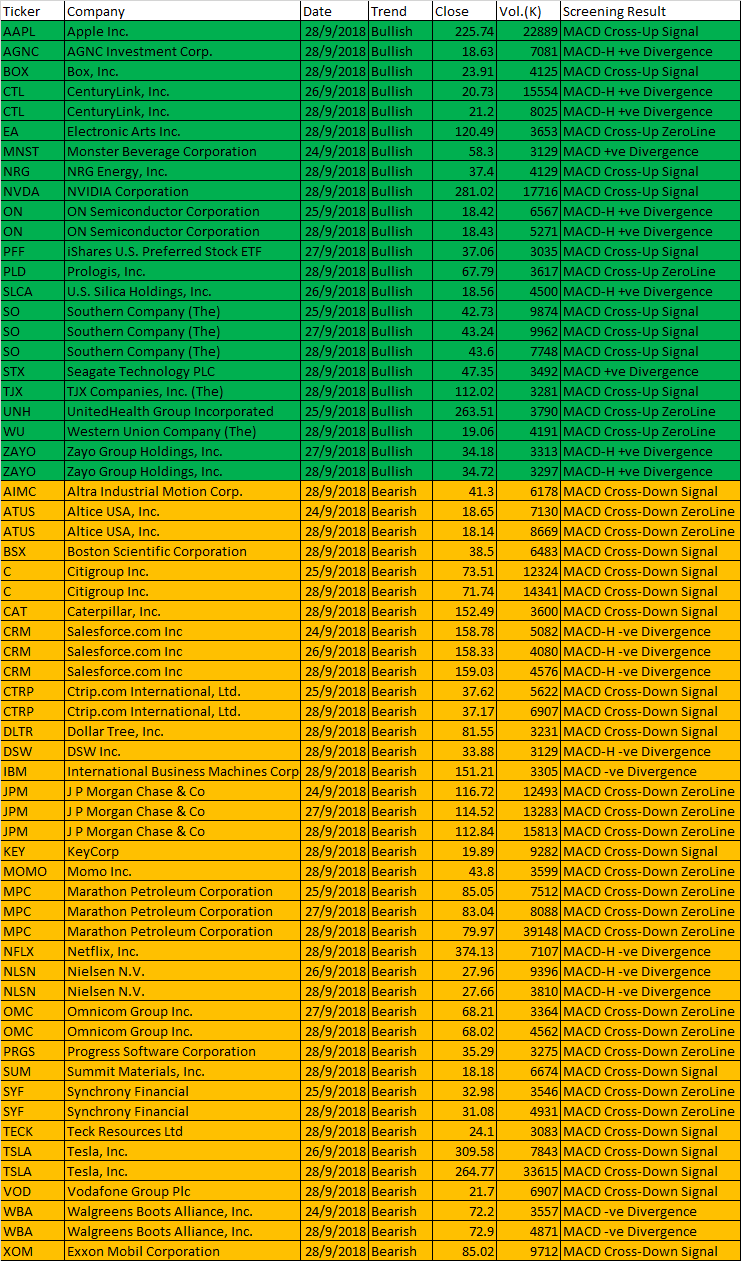
24 to 28 September, 2018 – Script Generated Five-day U.S. Stock MACD Signals
The following are script generated One-day U.S. Stock Market MACD signals using the Powerful AmiBroker’s AFL.
The MACD Setting used is (8,17,9)
| Ticker | Company | Date | Trend | Close | Vol.(K) | Screening Result |
| AAPL | Apple Inc. | 28/9/2018 | Bullish | 225.74 | 22889 | MACD Cross-Up Signal |
| AGNC | AGNC Investment Corp. | 28/9/2018 | Bullish | 18.63 | 7081 | MACD-H +ve Divergence |
| BOX | Box, Inc. | 28/9/2018 | Bullish | 23.91 | 4125 | MACD Cross-Up Signal |
| CTL | CenturyLink, Inc. | 26/9/2018 | Bullish | 20.73 | 15554 | MACD-H +ve Divergence |
| CTL | CenturyLink, Inc. | 28/9/2018 | Bullish | 21.2 | 8025 | MACD-H +ve Divergence |
| EA | Electronic Arts Inc. | 28/9/2018 | Bullish | 120.49 | 3653 | MACD Cross-Up ZeroLine |
| MNST | Monster Beverage Corporation | 24/9/2018 | Bullish | 58.3 | 3129 | MACD +ve Divergence |
| NRG | NRG Energy, Inc. | 28/9/2018 | Bullish | 37.4 | 4129 | MACD Cross-Up Signal |
| NVDA | NVIDIA Corporation | 28/9/2018 | Bullish | 281.02 | 17716 | MACD Cross-Up Signal |
| ON | ON Semiconductor Corporation | 25/9/2018 | Bullish | 18.42 | 6567 | MACD-H +ve Divergence |
| ON | ON Semiconductor Corporation | 28/9/2018 | Bullish | 18.43 | 5271 | MACD-H +ve Divergence |
| PFF | iShares U.S. Preferred Stock ETF | 27/9/2018 | Bullish | 37.06 | 3035 | MACD Cross-Up Signal |
| PLD | Prologis, Inc. | 28/9/2018 | Bullish | 67.79 | 3617 | MACD Cross-Up ZeroLine |
| SLCA | U.S. Silica Holdings, Inc. | 26/9/2018 | Bullish | 18.56 | 4500 | MACD-H +ve Divergence |
| SO | Southern Company (The) | 25/9/2018 | Bullish | 42.73 | 9874 | MACD Cross-Up Signal |
| SO | Southern Company (The) | 27/9/2018 | Bullish | 43.24 | 9962 | MACD Cross-Up Signal |
| SO | Southern Company (The) | 28/9/2018 | Bullish | 43.6 | 7748 | MACD Cross-Up Signal |
| STX | Seagate Technology PLC | 28/9/2018 | Bullish | 47.35 | 3492 | MACD +ve Divergence |
| TJX | TJX Companies, Inc. (The) | 28/9/2018 | Bullish | 112.02 | 3281 | MACD Cross-Up Signal |
| UNH | UnitedHealth Group Incorporated | 25/9/2018 | Bullish | 263.51 | 3790 | MACD Cross-Up ZeroLine |
| WU | Western Union Company (The) | 28/9/2018 | Bullish | 19.06 | 4191 | MACD Cross-Up ZeroLine |
| ZAYO | Zayo Group Holdings, Inc. | 27/9/2018 | Bullish | 34.18 | 3313 | MACD-H +ve Divergence |
| ZAYO | Zayo Group Holdings, Inc. | 28/9/2018 | Bullish | 34.72 | 3297 | MACD-H +ve Divergence |
| AIMC | Altra Industrial Motion Corp. | 28/9/2018 | Bearish | 41.3 | 6178 | MACD Cross-Down Signal |
| ATUS | Altice USA, Inc. | 24/9/2018 | Bearish | 18.65 | 7130 | MACD Cross-Down ZeroLine |
| ATUS | Altice USA, Inc. | 28/9/2018 | Bearish | 18.14 | 8669 | MACD Cross-Down ZeroLine |
| BSX | Boston Scientific Corporation | 28/9/2018 | Bearish | 38.5 | 6483 | MACD Cross-Down Signal |
| C | Citigroup Inc. | 25/9/2018 | Bearish | 73.51 | 12324 | MACD Cross-Down Signal |
| C | Citigroup Inc. | 28/9/2018 | Bearish | 71.74 | 14341 | MACD Cross-Down Signal |
| CAT | Caterpillar, Inc. | 28/9/2018 | Bearish | 152.49 | 3600 | MACD Cross-Down Signal |
| CRM | Salesforce.com Inc | 24/9/2018 | Bearish | 158.78 | 5082 | MACD-H -ve Divergence |
| CRM | Salesforce.com Inc | 26/9/2018 | Bearish | 158.33 | 4080 | MACD-H -ve Divergence |
| CRM | Salesforce.com Inc | 28/9/2018 | Bearish | 159.03 | 4576 | MACD-H -ve Divergence |
| CTRP | Ctrip.com International, Ltd. | 25/9/2018 | Bearish | 37.62 | 5622 | MACD Cross-Down Signal |
| CTRP | Ctrip.com International, Ltd. | 28/9/2018 | Bearish | 37.17 | 6907 | MACD Cross-Down Signal |
| DLTR | Dollar Tree, Inc. | 28/9/2018 | Bearish | 81.55 | 3231 | MACD Cross-Down Signal |
| DSW | DSW Inc. | 28/9/2018 | Bearish | 33.88 | 3129 | MACD-H -ve Divergence |
| IBM | International Business Machines Corporation | 28/9/2018 | Bearish | 151.21 | 3305 | MACD -ve Divergence |
| JPM | J P Morgan Chase & Co | 24/9/2018 | Bearish | 116.72 | 12493 | MACD Cross-Down ZeroLine |
| JPM | J P Morgan Chase & Co | 27/9/2018 | Bearish | 114.52 | 13283 | MACD Cross-Down ZeroLine |
| JPM | J P Morgan Chase & Co | 28/9/2018 | Bearish | 112.84 | 15813 | MACD Cross-Down ZeroLine |
| KEY | KeyCorp | 28/9/2018 | Bearish | 19.89 | 9282 | MACD Cross-Down Signal |
| MOMO | Momo Inc. | 28/9/2018 | Bearish | 43.8 | 3599 | MACD Cross-Down ZeroLine |
| MPC | Marathon Petroleum Corporation | 25/9/2018 | Bearish | 85.05 | 7512 | MACD Cross-Down ZeroLine |
| MPC | Marathon Petroleum Corporation | 27/9/2018 | Bearish | 83.04 | 8088 | MACD Cross-Down ZeroLine |
| MPC | Marathon Petroleum Corporation | 28/9/2018 | Bearish | 79.97 | 39148 | MACD Cross-Down ZeroLine |
| NFLX | Netflix, Inc. | 28/9/2018 | Bearish | 374.13 | 7107 | MACD-H -ve Divergence |
| NLSN | Nielsen N.V. | 26/9/2018 | Bearish | 27.96 | 9396 | MACD-H -ve Divergence |
| NLSN | Nielsen N.V. | 28/9/2018 | Bearish | 27.66 | 3810 | MACD-H -ve Divergence |
| OMC | Omnicom Group Inc. | 27/9/2018 | Bearish | 68.21 | 3364 | MACD Cross-Down ZeroLine |
| OMC | Omnicom Group Inc. | 28/9/2018 | Bearish | 68.02 | 4562 | MACD Cross-Down ZeroLine |
| PRGS | Progress Software Corporation | 28/9/2018 | Bearish | 35.29 | 3275 | MACD Cross-Down ZeroLine |
| SUM | Summit Materials, Inc. | 28/9/2018 | Bearish | 18.18 | 6674 | MACD Cross-Down Signal |
| SYF | Synchrony Financial | 25/9/2018 | Bearish | 32.98 | 3546 | MACD Cross-Down ZeroLine |
| SYF | Synchrony Financial | 28/9/2018 | Bearish | 31.08 | 4931 | MACD Cross-Down ZeroLine |
| TECK | Teck Resources Ltd | 28/9/2018 | Bearish | 24.1 | 3083 | MACD Cross-Down Signal |
| TSLA | Tesla, Inc. | 26/9/2018 | Bearish | 309.58 | 7843 | MACD Cross-Down Signal |
| TSLA | Tesla, Inc. | 28/9/2018 | Bearish | 264.77 | 33615 | MACD Cross-Down Signal |
| VOD | Vodafone Group Plc | 28/9/2018 | Bearish | 21.7 | 6907 | MACD Cross-Down Signal |
| WBA | Walgreens Boots Alliance, Inc. | 24/9/2018 | Bearish | 72.2 | 3557 | MACD -ve Divergence |
| WBA | Walgreens Boots Alliance, Inc. | 28/9/2018 | Bearish | 72.9 | 4871 | MACD -ve Divergence |
| XOM | Exxon Mobil Corporation | 28/9/2018 | Bearish | 85.02 | 9712 | MACD Cross-Down Signal |
September 24 to 28, 2018 US Stock Five-day MACD Signals
Moses U.S. Stock MACD Scan
AmiBroker Academy.com
Disclaimer
The above result is for illustration purpose. It is not meant to be used for buy or sell decision. We do not recommend any particular stocks. If particular stocks of such are mentioned, they are meant as demonstration of Amibroker as a powerful charting software and MACD. Amibroker can program to scan the stocks for buy and sell signals.
These are script generated signals. Not all scan results are shown here. The MACD signal should use with price action. Users must understand what MACD and price action are all about before using them. If necessary you should attend a course to learn more on Technical Analysis (TA) and Moving Average Convergence Divergence, MACD.
Once again, the website does not guarantee any results or investment return based on the information and instruction you have read here. It should be used as learning aids only and if you decide to trade real money, all trading decision should be your own.