16 July, 2018
Thanks for visiting the site.
Free U.S. Stock MACD Scan
What is MACD?
MACD stands for Moving Average Convergence Divergence, common setting is (12,26,9)
MACD indicator is a trend trading system that makes up of 2 lines. The MACD Line (fast line) and MACD Signal Line (slow line).
1) When the MACD Line crosses over the MACD Signal Line the trend is bullish. When the MACD Line crosses below the MACD Signal the trend is bearish.
2) When the MACD Line crosses above zero line the trend is bullish. When the MACD line crosses below zero line the trend is bearish.
July 9 to 13, 2018 – Script Generated Five-day U.S. Stock MACD Signals
The following are script generated One-day U.S. Stock Market MACD signals using the Powerful AmiBroker’s AFL.
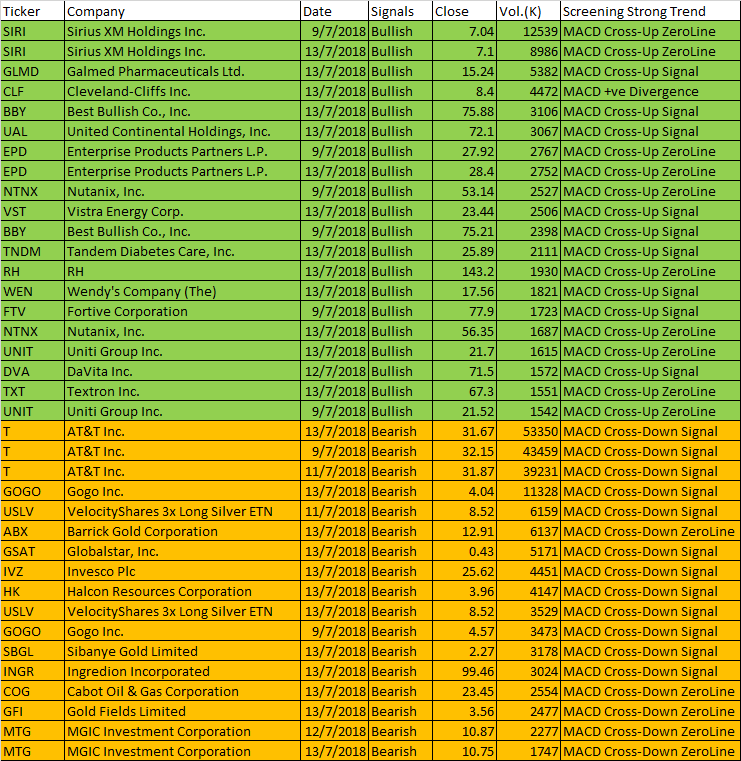
Results of 2018 July 9 to 13 Five-day U.S. Stocks MACD Scan
For stocks closed greater than 18 dollars and at least 300,000 changed hands.
The MACD Setting used is (8,17,9)
| Ticker | Company | Date | Signals | Close | Vol.(K) | Screening Strong Trend |
| SIRI | Sirius XM Holdings Inc. | 9/7/2018 | Bullish | 7.04 | 12539 | MACD Cross-Up ZeroLine |
| SIRI | Sirius XM Holdings Inc. | 13/7/2018 | Bullish | 7.1 | 8986 | MACD Cross-Up ZeroLine |
| GLMD | Galmed Pharmaceuticals Ltd. | 13/7/2018 | Bullish | 15.24 | 5382 | MACD Cross-Up Signal |
| CLF | Cleveland-Cliffs Inc. | 13/7/2018 | Bullish | 8.4 | 4472 | MACD +ve Divergence |
| BBY | Best Bullish Co., Inc. | 13/7/2018 | Bullish | 75.88 | 3106 | MACD Cross-Up Signal |
| UAL | United Continental Holdings, Inc. | 13/7/2018 | Bullish | 72.1 | 3067 | MACD Cross-Up Signal |
| EPD | Enterprise Products Partners L.P. | 9/7/2018 | Bullish | 27.92 | 2767 | MACD Cross-Up ZeroLine |
| EPD | Enterprise Products Partners L.P. | 13/7/2018 | Bullish | 28.4 | 2752 | MACD Cross-Up ZeroLine |
| NTNX | Nutanix, Inc. | 9/7/2018 | Bullish | 53.14 | 2527 | MACD Cross-Up ZeroLine |
| VST | Vistra Energy Corp. | 13/7/2018 | Bullish | 23.44 | 2506 | MACD Cross-Up Signal |
| BBY | Best Bullish Co., Inc. | 9/7/2018 | Bullish | 75.21 | 2398 | MACD Cross-Up Signal |
| TNDM | Tandem Diabetes Care, Inc. | 13/7/2018 | Bullish | 25.89 | 2111 | MACD Cross-Up Signal |
| RH | RH | 13/7/2018 | Bullish | 143.2 | 1930 | MACD Cross-Up ZeroLine |
| WEN | Wendy’s Company (The) | 13/7/2018 | Bullish | 17.56 | 1821 | MACD Cross-Up Signal |
| FTV | Fortive Corporation | 9/7/2018 | Bullish | 77.9 | 1723 | MACD Cross-Up Signal |
| NTNX | Nutanix, Inc. | 13/7/2018 | Bullish | 56.35 | 1687 | MACD Cross-Up ZeroLine |
| UNIT | Uniti Group Inc. | 13/7/2018 | Bullish | 21.7 | 1615 | MACD Cross-Up ZeroLine |
| DVA | DaVita Inc. | 12/7/2018 | Bullish | 71.5 | 1572 | MACD Cross-Up Signal |
| TXT | Textron Inc. | 13/7/2018 | Bullish | 67.3 | 1551 | MACD Cross-Up ZeroLine |
| UNIT | Uniti Group Inc. | 9/7/2018 | Bullish | 21.52 | 1542 | MACD Cross-Up ZeroLine |
| T | AT&T Inc. | 13/7/2018 | Bearish | 31.67 | 53350 | MACD Cross-Down Signal |
| T | AT&T Inc. | 9/7/2018 | Bearish | 32.15 | 43459 | MACD Cross-Down Signal |
| T | AT&T Inc. | 11/7/2018 | Bearish | 31.87 | 39231 | MACD Cross-Down Signal |
| GOGO | Gogo Inc. | 13/7/2018 | Bearish | 4.04 | 11328 | MACD Cross-Down Signal |
| USLV | VelocityShares 3x Long Silver ETN | 11/7/2018 | Bearish | 8.52 | 6159 | MACD Cross-Down Signal |
| ABX | Barrick Gold Corporation | 13/7/2018 | Bearish | 12.91 | 6137 | MACD Cross-Down ZeroLine |
| GSAT | Globalstar, Inc. | 13/7/2018 | Bearish | 0.43 | 5171 | MACD Cross-Down Signal |
| IVZ | Invesco Plc | 13/7/2018 | Bearish | 25.62 | 4451 | MACD Cross-Down Signal |
| HK | Halcon Resources Corporation | 13/7/2018 | Bearish | 3.96 | 4147 | MACD Cross-Down Signal |
| USLV | VelocityShares 3x Long Silver ETN | 13/7/2018 | Bearish | 8.52 | 3529 | MACD Cross-Down Signal |
| GOGO | Gogo Inc. | 9/7/2018 | Bearish | 4.57 | 3473 | MACD Cross-Down Signal |
| SBGL | Sibanye Gold Limited | 13/7/2018 | Bearish | 2.27 | 3178 | MACD Cross-Down Signal |
| INGR | Ingredion Incorporated | 13/7/2018 | Bearish | 99.46 | 3024 | MACD Cross-Down Signal |
| COG | Cabot Oil & Gas Corporation | 13/7/2018 | Bearish | 23.45 | 2554 | MACD Cross-Down ZeroLine |
| GFI | Gold Fields Limited | 13/7/2018 | Bearish | 3.56 | 2477 | MACD Cross-Down ZeroLine |
| MTG | MGIC Investment Corporation | 12/7/2018 | Bearish | 10.87 | 2277 | MACD Cross-Down ZeroLine |
| MTG | MGIC Investment Corporation | 13/7/2018 | Bearish | 10.75 | 1747 | MACD Cross-Down ZeroLine |
July 9 to 13, 2018 US Stock Five-day MACD Signals
Moses U.S. Stock MACD Scan
AmiBroker Academy.com
Disclaimer
The above result is for illustration purpose. It is not meant to be used for buy or sell decision. We do not recommend any particular stocks. If particular stocks of such are mentioned, they are meant as demonstration of Amibroker as a powerful charting software and MACD. Amibroker can program to scan the stocks for buy and sell signals.
These are script generated signals. Not all scan results are shown here. The MACD signal should use with price action. Users must understand what MACD and price action are all about before using them. If necessary you should attend a course to learn more on Technical Analysis (TA) and Moving Average Convergence Divergence, MACD.
Once again, the website does not guarantee any results or investment return based on the information and instruction you have read here. It should be used as learning aids only and if you decide to trade real money, all trading decision should be your own.