17 November, 2018
Thanks for visiting the site.
Free U.S. Stock Five-day MACD Scan
Wht is AmiBroker AFL?
See the following link https://www.amibroker.com/guide/AFL.html on AmiBroker AFL.
What is MACD?
MACD stands for Moving Average Convergence Divergence, common setting is (12,26,9)
MACD indicator is a trend trading system that makes up of 2 lines. The MACD Line (fast line) and MACD Signal Line (slow line).
1) When the MACD Line crosses over the MACD Signal Line the trend is bullish. When the MACD Line crosses below the MACD Signal the trend is bearish.
2) When the MACD Line crosses above zero line the trend is bullish. When the MACD line crosses below zero line the trend is bearish.
12 to 16 November 2018 AFL Script Generated Five-day U.S. Stock MACD Signals
The following are script generated Five-day U.S. Stock Market MACD signals using the Powerful AmiBroker’s AFL.
The MACD Setting used is (8,17,9)
| Ticker | Company | Date | Bull/Bear | Close | Vol.(K) | Screening Result |
| ABT | Abbott Laboratories | 14/11/2018 | Bull | 69.41 | 5401 | MACD Cross-Up Signal |
| ABT | Abbott Laboratories | 16/11/2018 | Bull | 72.04 | 9525 | MACD Cross-Up Signal |
| AMAT | Applied Materials, Inc. | 12/11/2018 | Bull | 32.62 | 10618 | MACD Cross-Up ZeroLine |
| AMAT | Applied Materials, Inc. | 16/11/2018 | Bull | 35.4 | 28071 | MACD Cross-Up ZeroLine |
| BSX | Boston Scientific Corporation | 14/11/2018 | Bull | 36.21 | 5521 | MACD Cross-Up ZeroLine |
| BSX | Boston Scientific Corporation | 15/11/2018 | Bull | 36.47 | 9055 | MACD Cross-Up ZeroLine |
| BSX | Boston Scientific Corporation | 16/11/2018 | Bull | 37.21 | 7538 | MACD Cross-Up ZeroLine |
| CAG | ConAgra Brands, Inc. | 16/11/2018 | Bull | 33.07 | 8487 | MACD-H +ve Divergence |
| CELG | Celgene Corporation | 14/11/2018 | Bull | 69.63 | 6964 | MACD-H +ve Divergence |
| CELG | Celgene Corporation | 16/11/2018 | Bull | 69.65 | 9132 | MACD-H +ve Divergence |
| CSCO | Cisco Systems, Inc. | 14/11/2018 | Bull | 44.33 | 36614 | MACD Cross-Up Signal |
| CSCO | Cisco Systems, Inc. | 15/11/2018 | Bull | 46.77 | 45983 | MACD Cross-Up Signal |
| CSCO | Cisco Systems, Inc. | 16/11/2018 | Bull | 46.35 | 31051 | MACD Cross-Up Signal |
| DHI | D.R. Horton, Inc. | 12/11/2018 | Bull | 33.89 | 6772 | MACD-H +ve Divergence |
| DHI | D.R. Horton, Inc. | 13/11/2018 | Bull | 34.69 | 7578 | MACD-H +ve Divergence |
| HAL | Halliburton Company | 13/11/2018 | Bull | 32.27 | 21537 | MACD-H +ve Divergence |
| HAL | Halliburton Company | 16/11/2018 | Bull | 32.46 | 7897 | MACD-H +ve Divergence |
| INTC | Intel Corporation | 13/11/2018 | Bull | 47.39 | 29316 | MACD Cross-Up Signal |
| INTC | Intel Corporation | 16/11/2018 | Bull | 48.83 | 31419 | MACD Cross-Up Signal |
| LEN | Lennar Corporation | 16/11/2018 | Bull | 41.05 | 5243 | MACD-H +ve Divergence |
| MDT | Medtronic plc | 16/11/2018 | Bull | 93.7 | 7916 | MACD Cross-Up ZeroLine |
| MSFT | Microsoft Corporation | 13/11/2018 | Bull | 106.94 | 35375 | MACD Cross-Up Signal |
| MSFT | Microsoft Corporation | 14/11/2018 | Bull | 104.97 | 39495 | MACD Cross-Up Signal |
| MSFT | Microsoft Corporation | 16/11/2018 | Bull | 108.29 | 33497 | MACD Cross-Up Signal |
| NOV | National Oilwell Varco, Inc. | 13/11/2018 | Bull | 32.91 | 5056 | MACD Cross-Up Signal |
| PE | Parsley Energy, Inc. | 13/11/2018 | Bull | 22.07 | 8305 | MACD-H +ve Divergence |
| PE | Parsley Energy, Inc. | 16/11/2018 | Bull | 22.14 | 6876 | MACD-H +ve Divergence |
| PHM | PulteGroup, Inc. | 15/11/2018 | Bull | 24.11 | 8303 | MACD Cross-Up Signal |
| PHM | PulteGroup, Inc. | 16/11/2018 | Bull | 24.97 | 7501 | MACD Cross-Up Signal |
| SHV | iShares Short Treasury Bond ETF | 16/11/2018 | Bull | 110.37 | 7549 | MACD Cross-Up ZeroLine |
| TLT | iShares 20+ Year Treasury Bond ETF | 16/11/2018 | Bull | 114.7 | 9237 | MACD Cross-Up ZeroLine |
| TMUS | T-Mobile US, Inc. | 16/11/2018 | Bull | 69.14 | 5253 | MACD Cross-Up Signal |
| TQQQ | ProShares UltraPro QQQ | 14/11/2018 | Bull | 47.65 | 19516 | MACD Cross-Up Signal |
| TQQQ | ProShares UltraPro QQQ | 16/11/2018 | Bull | 49.65 | 16764 | MACD Cross-Up Signal |
| TRU | TransUnion | 14/11/2018 | Bull | 60.47 | 5838 | MACD-H +ve Divergence |
| TSN | Tyson Foods, Inc. | 13/11/2018 | Bull | 58.17 | 7846 | MACD +ve Divergence |
| TSRO | TESARO, Inc. | 16/11/2018 | Bull | 34.96 | 7649 | MACD Cross-Up Signal |
| VIAB | Viacom Inc. | 15/11/2018 | Bull | 31.83 | 5873 | MACD Cross-Up Signal |
| VIAB | Viacom Inc. | 16/11/2018 | Bull | 32.99 | 7794 | MACD Cross-Up Signal |
| VLO | Valero Energy Corporation | 14/11/2018 | Bull | 82.34 | 5663 | MACD Cross-Up Signal |
| XOM | Exxon Mobil Corporation | 12/11/2018 | Bull | 79.83 | 11907 | MACD-H +ve Divergence |
| XOM | Exxon Mobil Corporation | 13/11/2018 | Bull | 78 | 15530 | MACD-H +ve Divergence |
| XOM | Exxon Mobil Corporation | 16/11/2018 | Bull | 78.96 | 13578 | MACD-H +ve Divergence |
| AMZN | Amazon.com, Inc. | 16/11/2018 | Bear | 1593.41 | 6061 | MACD Cross-Down Signal |
| DIS | Walt Disney Company (The) | 12/11/2018 | Bear | 116.7 | 9171 | MACD Cross-Down Signal |
| DIS | Walt Disney Company (The) | 16/11/2018 | Bear | 116.19 | 7142 | MACD Cross-Down Signal |
| HD | Home Depot, Inc. (The) | 16/11/2018 | Bear | 177.02 | 6834 | MACD Cross-Down Signal |
| KSS | Kohl’s Corporation | 14/11/2018 | Bear | 75.8 | 5841 | MACD Cross-Down ZeroLine |
| KSS | Kohl’s Corporation | 16/11/2018 | Bear | 72.49 | 6851 | MACD Cross-Down ZeroLine |
| NVDA | NVIDIA Corporation | 16/11/2018 | Bear | 164.43 | 49054 | MACD Cross-Down Signal |
| PYPL | PayPal Holdings, Inc. | 15/11/2018 | Bear | 86.74 | 10001 | MACD Cross-Down Signal |
| PYPL | PayPal Holdings, Inc. | 16/11/2018 | Bear | 85.06 | 7540 | MACD Cross-Down Signal |
| SBUX | Starbucks Corporation | 16/11/2018 | Bear | 68.16 | 9287 | MACD Cross-Down Signal |
| SQ | Square, Inc. | 14/11/2018 | Bear | 69.81 | 14252 | MACD Cross-Down Signal |
| SQ | Square, Inc. | 15/11/2018 | Bear | 73.6 | 12244 | MACD Cross-Down Signal |
| SQ | Square, Inc. | 16/11/2018 | Bear | 70.59 | 13297 | MACD Cross-Down Signal |
| SYF | Synchrony Financial | 16/11/2018 | Bear | 25.91 | 9307 | MACD Cross-Down Signal |
| WSM | Williams-Sonoma, Inc. | 16/11/2018 | Bear | 53.76 | 11523 | MACD Cross-Down ZeroLine |
if you can see the full chart, “press Ctrl and -” to zoom out and see the entire chart.
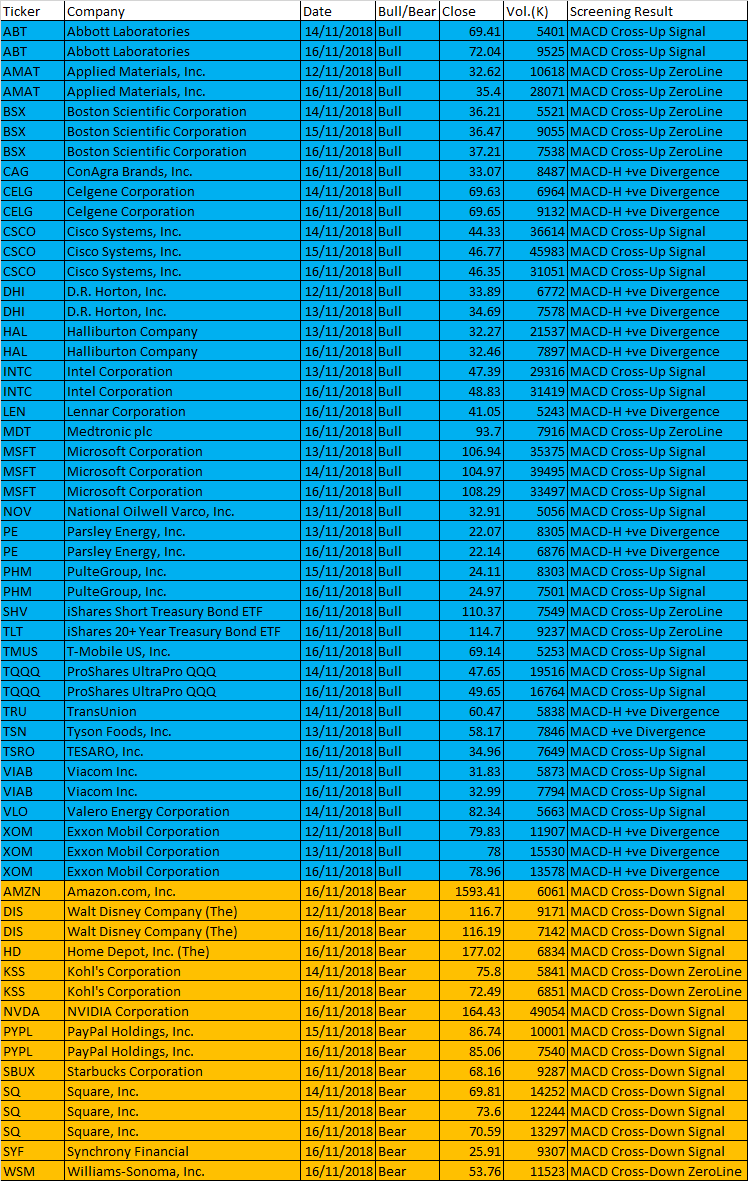
November 12 to 16, 2018 US Stock Five-day MACD Screener Signals
MACD Example – Cisco Systems Inc
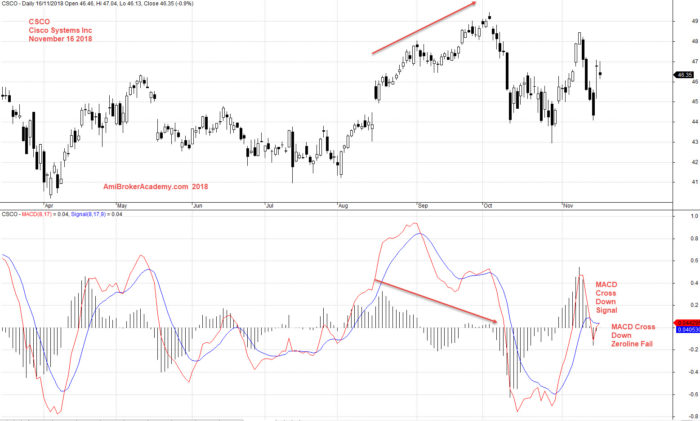
November 16, 2018 Cisco Systems Inc and MACD
Moses U.S. Stock MACD Scan
AmiBroker Academy.com
Disclaimer
The above result is for illustration purpose. It is not meant to be used for buy or sell decision. We do not recommend any particular stocks. If particular stocks of such are mentioned, they are meant as demonstration of Amibroker as a powerful charting software and MACD. Amibroker can program to scan the stocks for buy and sell signals.
These are script generated signals. Not all scan results are shown here. The MACD signal should use with price action. Users must understand what MACD and price action are all about before using them. If necessary you should attend a course to learn more on Technical Analysis (TA) and Moving Average Convergence Divergence, MACD.
Once again, the website does not guarantee any results or investment return based on the information and instruction you have read here. It should be used as learning aids only and if you decide to trade real money, all trading decision should be your own.