May 16, 2018
We had studied Shaanxi Aerospace Power Hi-Tech Co 航天动力 using Moving Average, MA and Bolinger Bands, BB. Now let review the stock using different tools. See below for more.
Shanghai Stock Analysis
Shaanxi Aerospace Power Hi-Tech Co 航天动力 and MA Wave
Picture worth a thousand words, see chart. We study Shaanxi Aerospace Power Hi-Tech Co 航天动力 instead of moving average and Bollinger bands. We use three MA, high, low and close. The three MAs form a band, we call it wave or river.
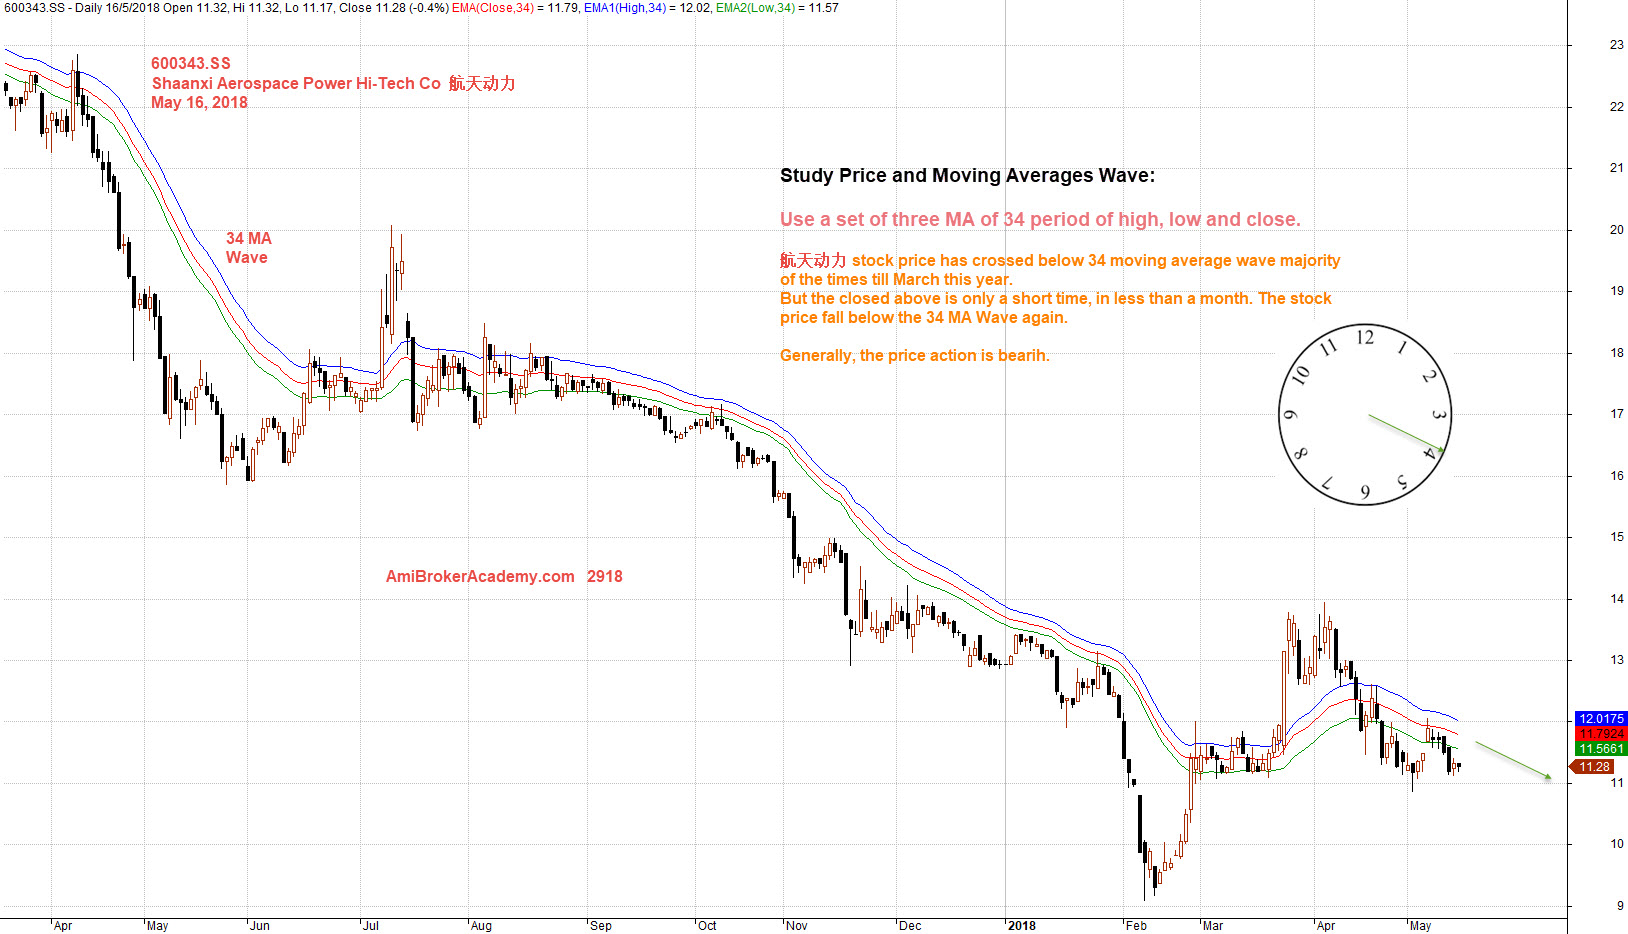
Study Price Action using Moving Averages Wave:
Use a set of three MA of 34 period of high, low and close.
航天动力 stock price has crossed below 34 moving average wave majority of the times till March this year.
But the closed above is only a short time, in less than a month. The stock price fall below the 34 MA Wave again.
Generally, the price action is bearish.
Manage your risk.
May 16, 2018 Shaanxi Aerospace Power Hi-Tech Co 航天动力 and MA Wave
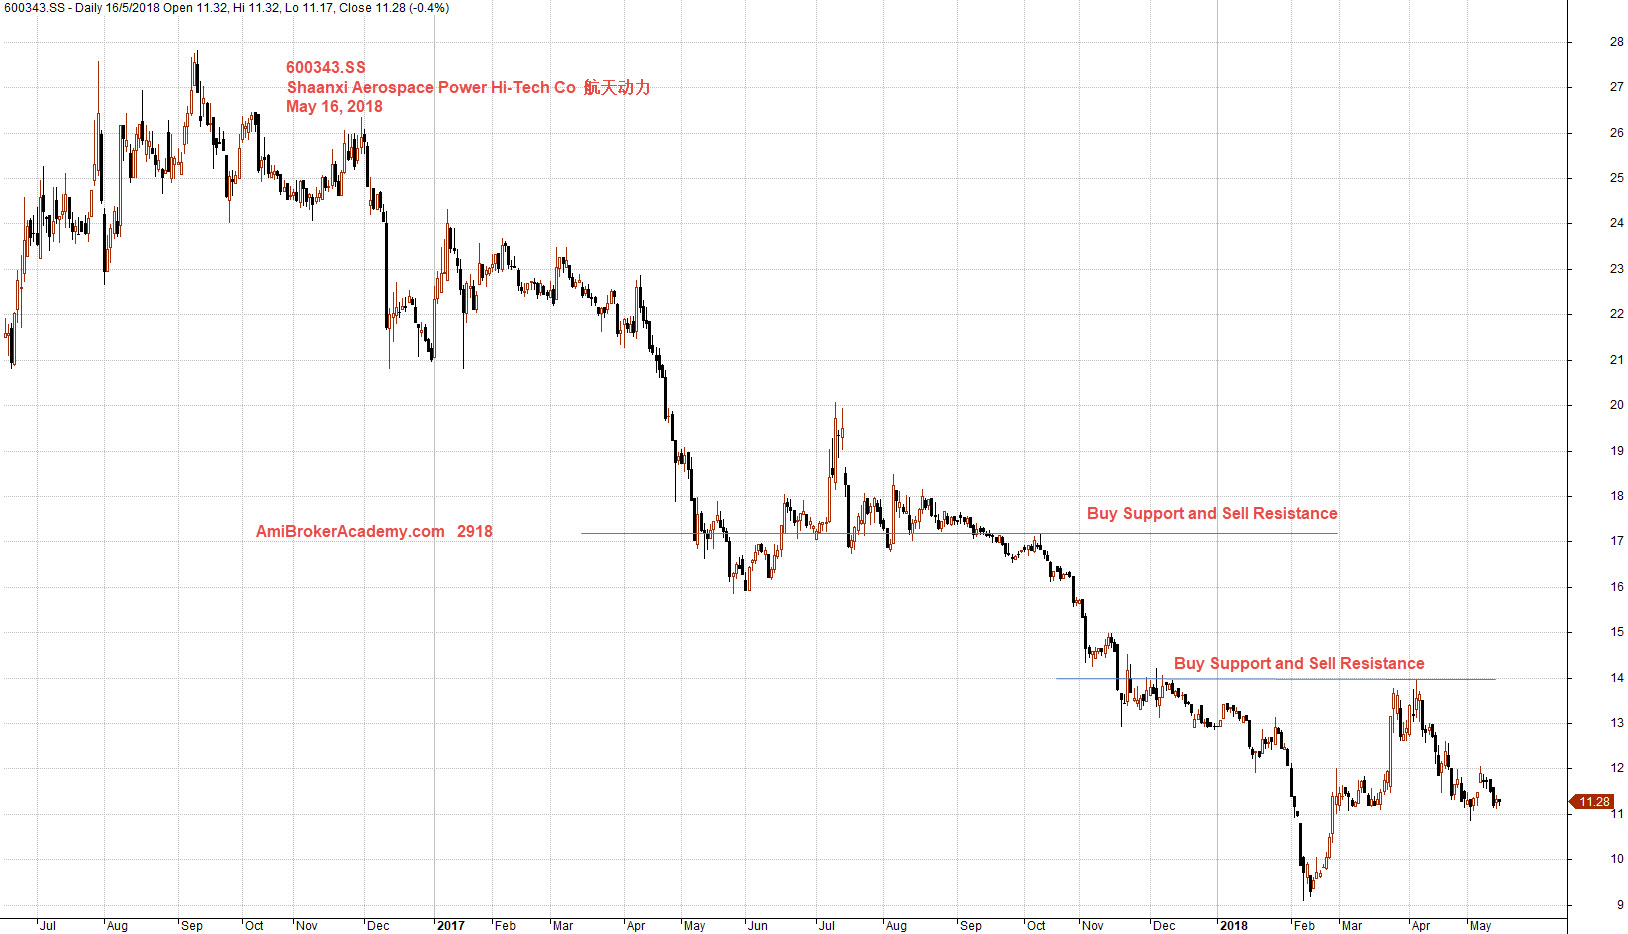
600343.SS Shaanxi Aerospace Power Hi-Tech Co 航天动力 Trade Strategy
See chart for more. We believe in keep the strategy simple, so buy support sell resistance is the best choice. Picture worth a thousand words, could you appreciate why? Manage your risk.
20180516 Shaanxi Aerospace Power Hi-Tech Co 航天动力 Trade Strategy
Powerful Chart Software – AmiBroker
The following chart is produced using AmiBroker charting software. It is a powerful chart software. You plot the stocks you are interested all in one chart, as long as you still could read them. See chart below.
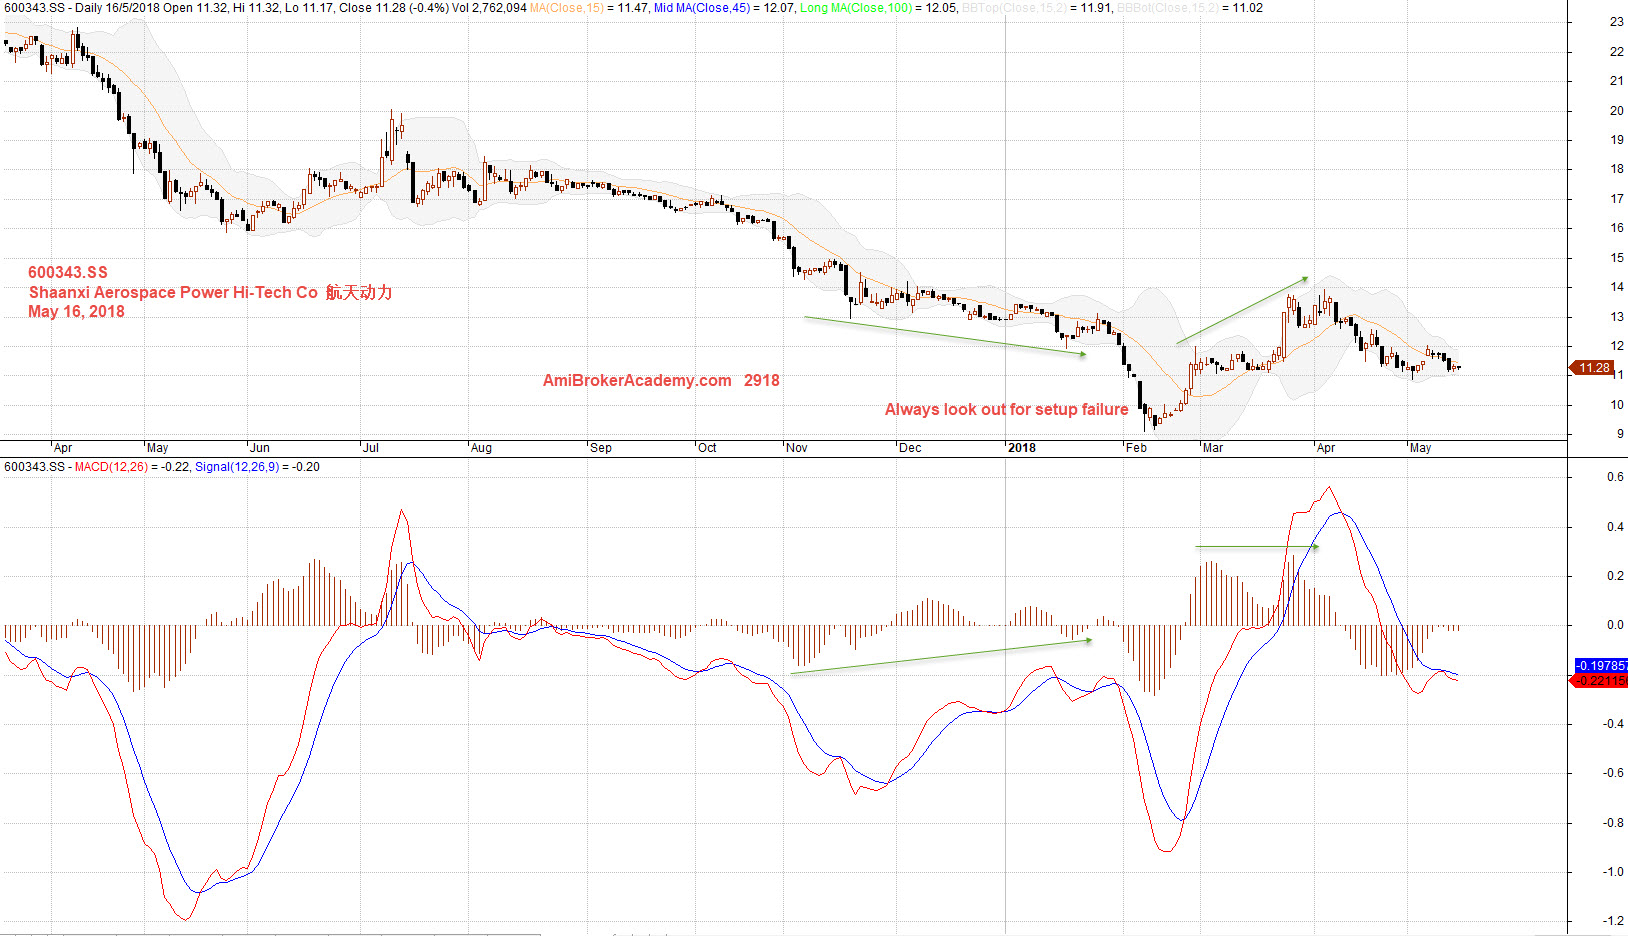
600343.SS Shaanxi Aerospace Power Hi-Tech Co 航天动力 and MACD
To understand the stock trend, use MACD. MACD is a leading indicator for trend and trend change. See chart.
May 16, 2018 Shaanxi Aerospace Power Hi-Tech Co 航天动力 and MACD
Moses
AmiBrokerAcademy.com
Disclaimer
The above result is for illustration purpose. It is not meant to be used for buy or sell decision. We do not recommend any particular stocks. If particular stocks of such are mentioned, they are meant as demonstration of Amibroker as a powerful charting software and MACD. Amibroker can program to scan the stocks for buy and sell signals.
These are script generated signals. Not all scan results are shown here. The MACD signal should use with price action. Users must understand what MACD and price action are all about before using them. If necessary you should attend a course to learn more on Technical Analysis (TA) and Moving Average Convergence Divergence, MACD.
Once again, the website does not guarantee any results or investment return based on the information and instruction you have read here. It should be used as learning aids only and if you decide to trade real money, all trading decision should be your own.