April 4, 2019
Welcome to AmiBrokerAcademy.com. Thanks for visiting the site.
We interpreting the markets emotion, price action using patterns and indicators. Hope this make sense to you. Have fun!

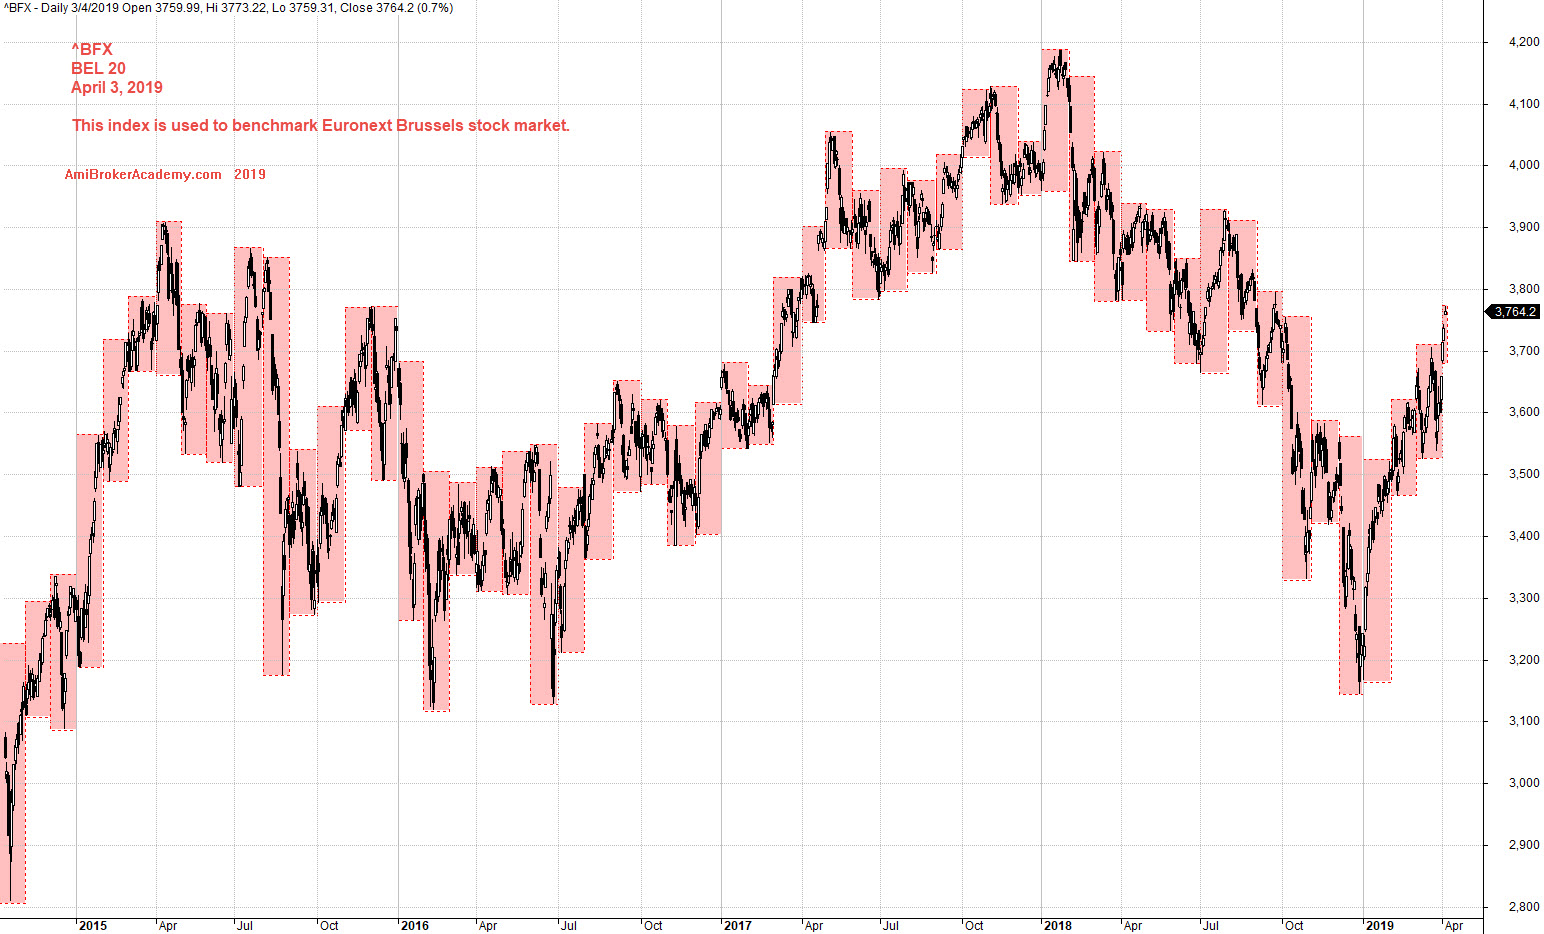
BEL 20 Index is the index consists of a minimum of 10 and a maximum of 20 companies traded at the Brussels Stock Exchange.
^BFX BEL 20 Index Stock Charting
Study BEL 20 Index Stock chart and month high low.
See chart, picture worth a thousand words.
See price action moves in zigzag manner.
Trade with your eyes open.
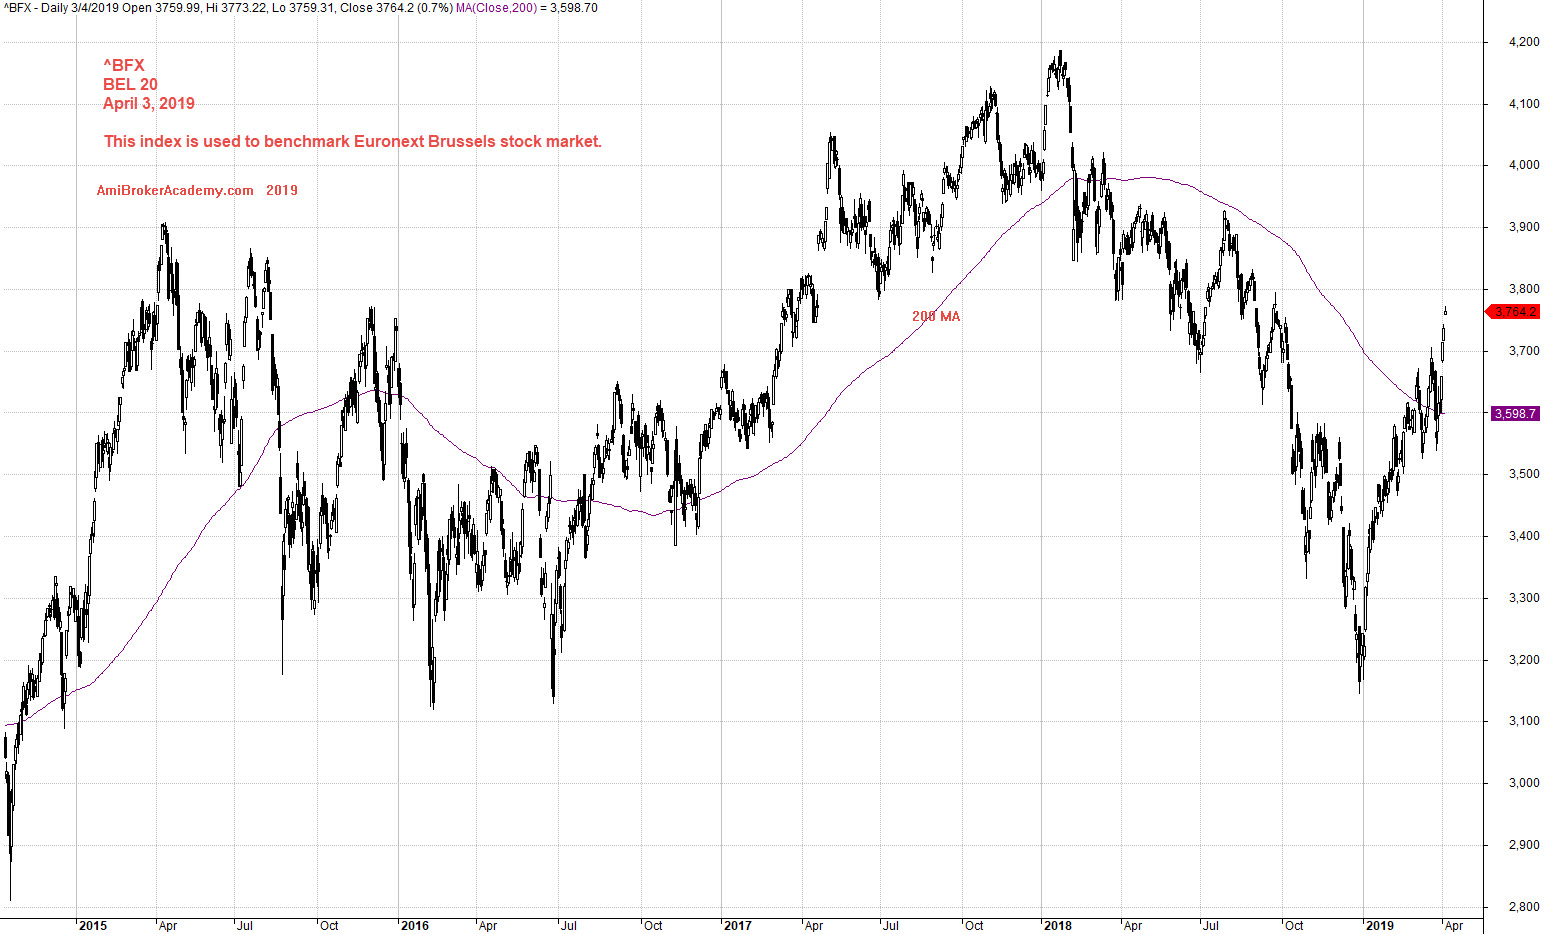
When you can not make up what you want and to trade. Study the chart from a different perspective, we use 200 MA. See the price action zigzag up and down of the MA. See chart.
Moses Stock Observation
Moses Stock Analysis
AmiBrokerAcademy.com
Disclaimer
Disclaimer
The above result is for illustration purpose. It is not meant to be used for buy or sell decision. We do not recommend any particular stocks. If particular stocks of such are mentioned, they are meant as demonstration of Amibroker as a powerful charting software and MACD. Amibroker can program to scan the stocks for buy and sell signals.
These are script generated signals. Not all scan results are shown here. The MACD signal should use with price action. Users must understand what MACD and price action are all about before using them. If necessary you should attend a course to learn more on Technical Analysis (TA) and Moving Average Convergence Divergence, MACD.
Once again, the website does not guarantee any results or investment return based on the information and instruction you have read here. It should be used as learning aids only and if you decide to trade real money, all trading decision should be your own.