2 March, 2018
In our last posting, we see a potential of the price action may test the 127% on Fibonacci Extension, but we caution you that manage your risk as all set up can fail. Besides that price action does not move in a straight line, it is moving in a zigzaq manner. Sometime one step forward and three steps backward, however finally still hit the target. See the following chart, there was two bearish bars after the strong jump up. See chart for more.
Powerful Chart Software – AmiBroker
The following chart is produced using AmiBroker charting software. It is a powerful chart software. You plot the stocks you are interested all in one chart, as long as you still could read them. See chart below. Thereafter slowly climb up, step by step.
US Stock Analysis
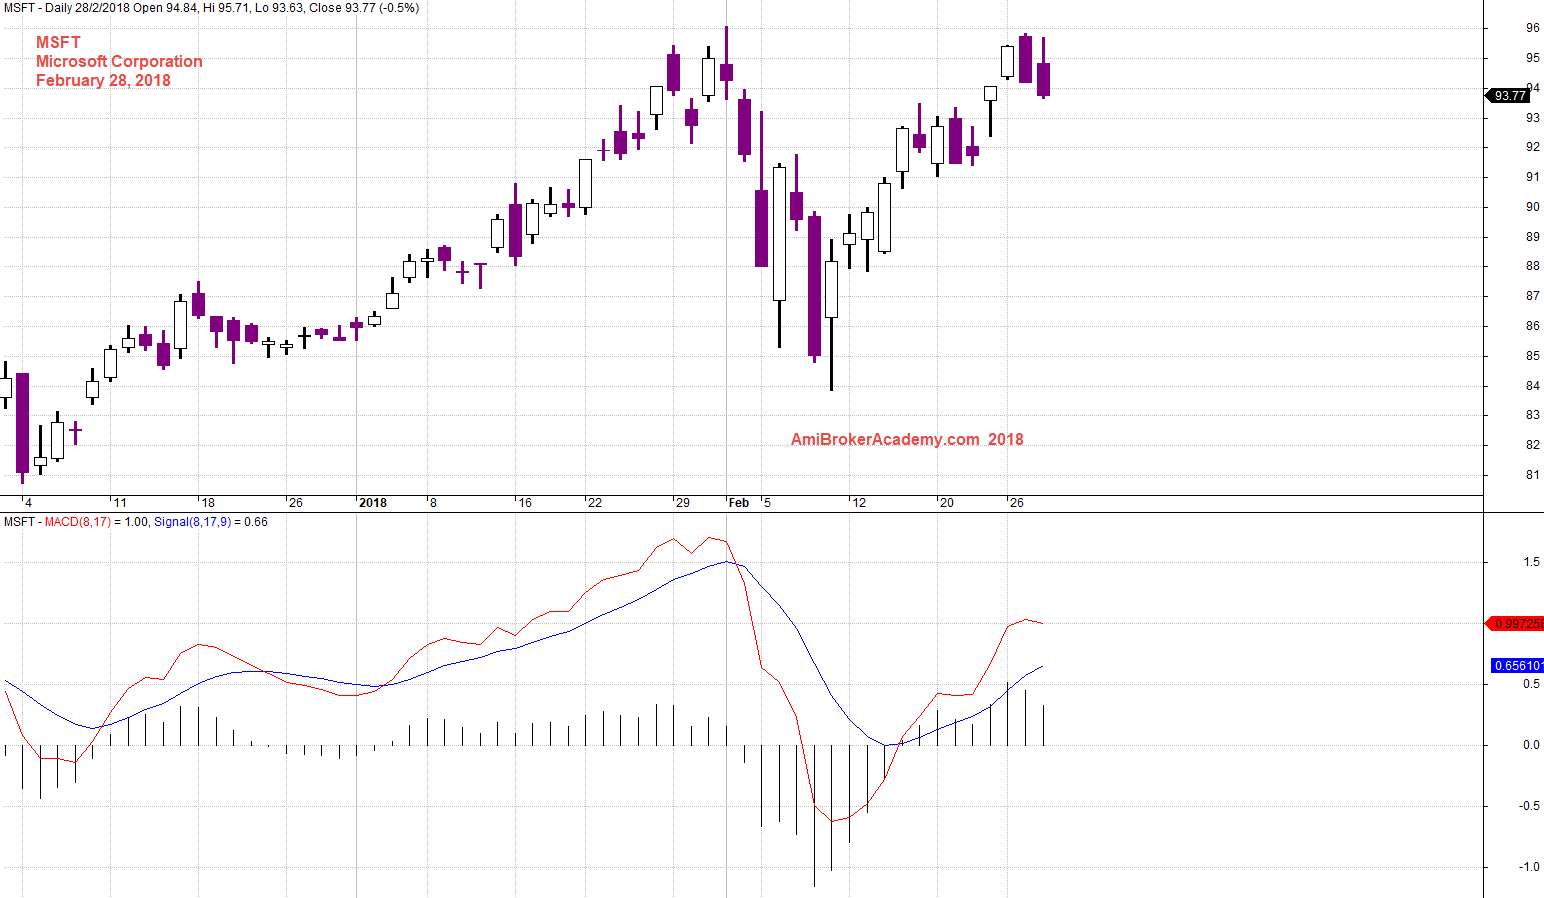
MSFT Microsoft Corporation and MACD
Study chart for more, picture worth a thousand words. After bullish bars and push up, the price action go into a bearish engulfing candlestick pattern. And follow on a close down bearish candlestick. Wow!
So, 96 dollars is a strong level to watch.
MACD and MACD Histogram are above the zeroline line, still bullish bias.
Remember Don’t Take the Prediction At Face Value
Do your own analysis?
Manage your risk!
20180228 Microsoft Corporation and MACD
MSFT Microsoft Corporation and Double Top
See chart for more, the double top is in progress.
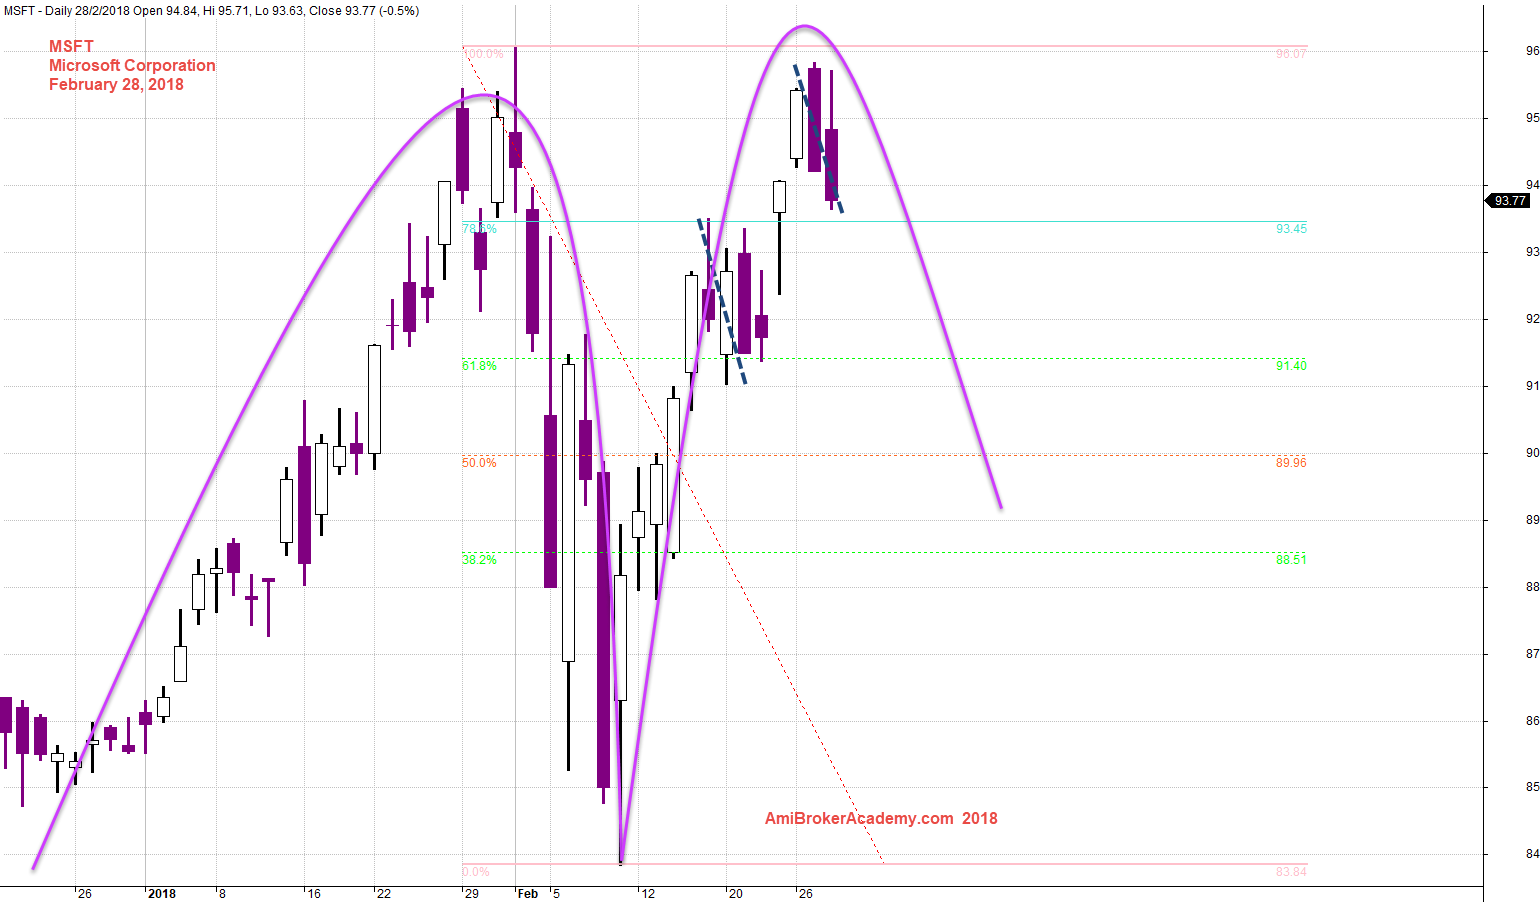
February 28, 2018 Microsoft Corporation and Double Top
Moses US Stock Analysis
AmiBrokerAcademy.com
Disclaimer
The above result is for illustration purpose. It is not meant to be used for buy or sell decision. We do not recommend any particular stocks. If particular stocks of such are mentioned, they are meant as demonstration of Amibroker as a powerful charting software and MACD. Amibroker can program to scan the stocks for buy and sell signals.
These are script generated signals. Not all scan results are shown here. The MACD signal should use with price action. Users must understand what MACD and price action are all about before using them. If necessary you should attend a course to learn more on Technical Analysis (TA) and Moving Average Convergence Divergence, MACD.
Once again, the website does not guarantee any results or investment return based on the information and instruction you have read here. It should be used as learning aids only and if you decide to trade real money, all trading decision should be your own.