May 13, 2019
Welcome to AmiBrokerAcademy.com. Thanks for visiting the site.
For the next three posting including this one, you will be learning something different from the same chart. Have fun!
^STI Straits Times Index 海峡时报指数 Stock Charting
Study Straits Times Index 海峡时报指数 Stock chart.
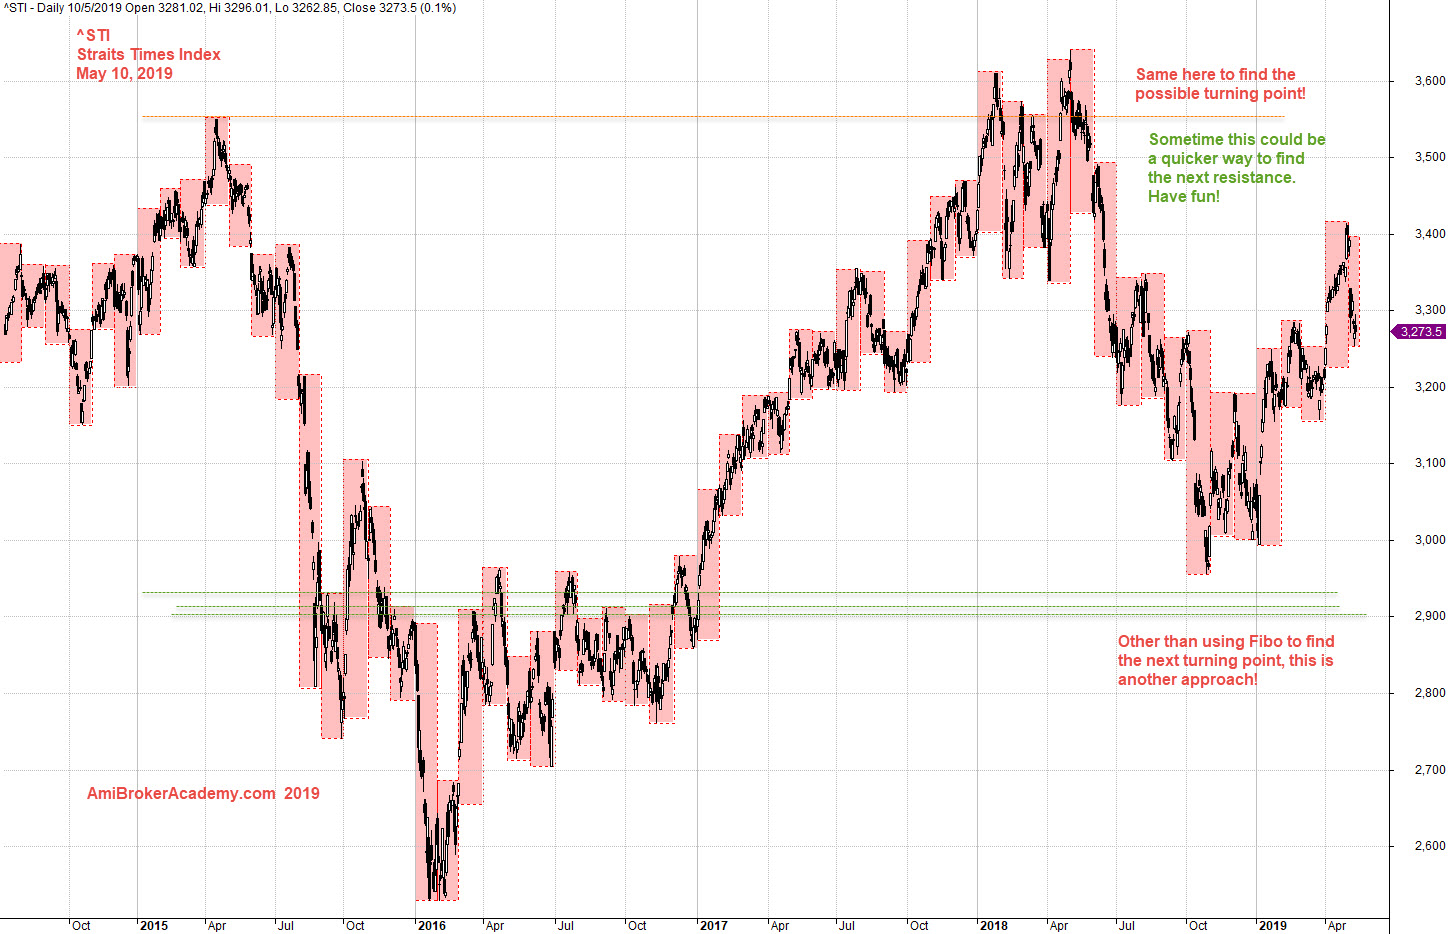
See chart, picture worth a thousand words.
We use month high low to help to find great support resistance. We all aware that the financial market has great memory.
See a major turning point like resistance will be a possible resistance or support again. See chart, look out the resistance for a bull trend near a past resistance. You will never wrong.
So, for a falling or decline trend, look out for a level that might stop the price action from continue to fall. See chart.
Trade with your eyes open.
Moses Stock Observation
AmiBrokerAcademy.com
Disclaimer
The above result is for illustration purpose. It is not meant to be used for buy or sell decision. We do not recommend any particular stocks. If particular stocks of such are mentioned, they are meant as demonstration of Amibroker as a powerful charting software and MACD. Amibroker can program to scan the stocks for buy and sell signals.
These are script generated signals. Not all scan results are shown here. The MACD signal should use with price action. Users must understand what MACD and price action are all about before using them. If necessary you should attend a course to learn more on Technical Analysis (TA) and Moving Average Convergence Divergence, MACD.
Once again, the website does not guarantee any results or investment return based on the information and instruction you have read here. It should be used as learning aids only and if you decide to trade real money, all trading decision should be your own.