28 August, 2018
Thanks for visiting the site.
Summary of the Market Cycle from 2014 till now
| Start | End | Trend |
| 21 January 2016 | 2 My 2018 | Bull |
| 16 April 2015 | 21 January 2016 | Bear |
| 4 February 2014 | 16 April 2015 | Bull |
See the chart from the posting for appreciation.
Stock market cycles are measured over different time horizons. It can be a short-term, or a long-term.
It will take a number of posting to study a particular stock, such as STI. We will study ST Index from to present.
ST Index The Straits Times Index Charting
From series 1 chart, we continue to look left. We see after the low at January 21 2016. The Index peak and it was at 16 April 2015. So this was the bear market cycle after the bull. What was the bull market cycle before this bear. Will see. Continue to look left further, The low as at 4 February 2014.
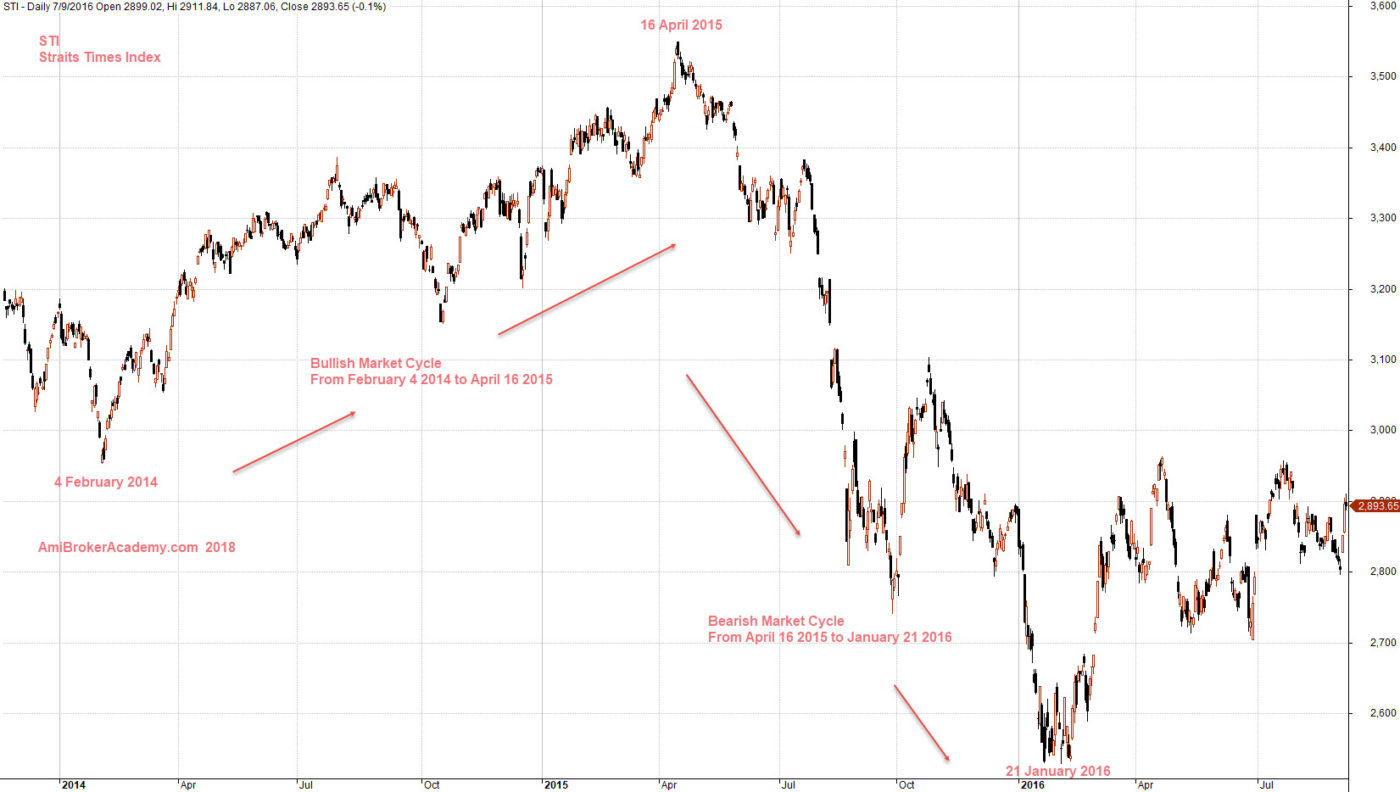
Series 2 – Straits Times Bullish and Bearish Market Cycle

Series 1 – Straits Times Index Bull Trend from January 2016 to May 2018
See chart, picture worth a thousand words. May 2 2018 is the peak so far. This probably the end or the previous bull trend cycle when look to the left. Now if you will look right, is a start of bear trend? May be it is too early to know.
Trade with eyes open.
Continue to look left to see the start point of the bull trend. January 21, 2016.
Manage your risk.
Another View of The Straits Times Index Charting
Picture worth a thousand words. See chart for more.
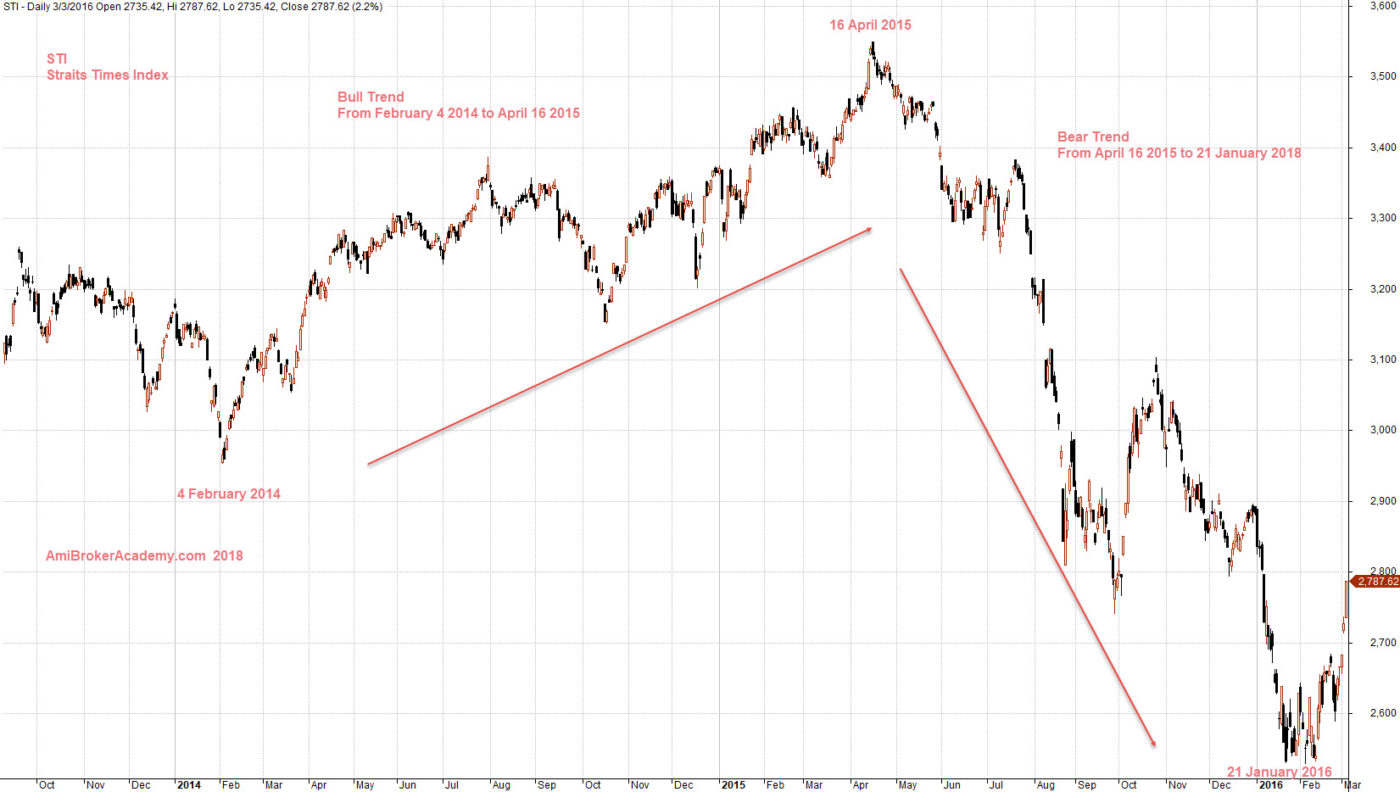
Another View of Straits Times on Bullish and Bearish Market Cycle
Moses Market Cycle
AmiBrokerAcademy.com
Disclaimer
The above result is for illustration purpose. It is not meant to be used for buy or sell decision. We do not recommend any particular stocks. If particular stocks of such are mentioned, they are meant as demonstration of Amibroker as a powerful charting software and MACD. Amibroker can program to scan the stocks for buy and sell signals.
These are script generated signals. Not all scan results are shown here. The MACD signal should use with price action. Users must understand what MACD and price action are all about before using them. If necessary you should attend a course to learn more on Technical Analysis (TA) and Moving Average Convergence Divergence, MACD.
Once again, the website does not guarantee any results or investment return based on the information and instruction you have read here. It should be used as learning aids only and if you decide to trade real money, all trading decision should be your own.