30 March 2019
Thanks for visiting the site.
Free U.S. Stock MACD Screener
What is MACD?
MACD stands for Moving Average Convergence Divergence, common setting is (12,26,9)
MACD indicator is a trend trading system that makes up of 2 lines. The MACD Line (fast line) and MACD Signal Line (slow line).
1) When the MACD Line crosses over the MACD Signal Line the trend is bullish. When the MACD Line crosses below the MACD Signal the trend is bearish.
2) When the MACD Line crosses above zero line the trend is bullish. When the MACD line crosses below zero line the trend is bearish.
What is AmiBroker AFL?
AmiBroker AFL stands for AmiBroker Formula Language.
AmiBroker equips with a powerful formula language allowing you to write trading system rules, define your own indicators and custom commentaries, such as the MACD Screener Script here.
Read more on the following link, https://www.amibroker.com/guide/AFL.html.
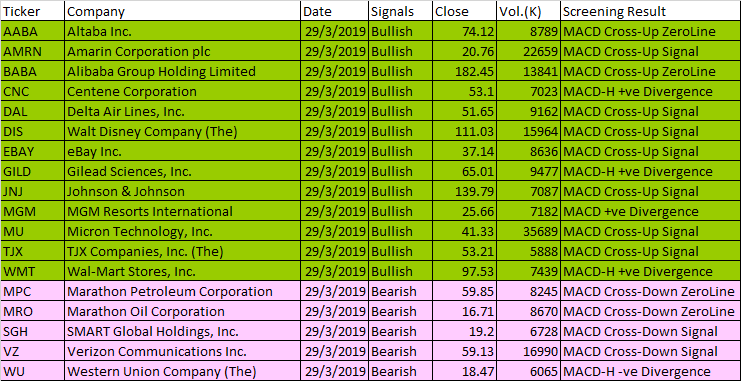
March 29, 2019 AFL Script Generated One-day U.S. Stock MACD Signals
The following are script generated One-day U.S. Stock Market MACD signals using the Powerful AmiBroker’s AFL.
The MACD Setting used is (8,17,9)
| Ticker | Company | Date | Signals | Close | Vol.(K) | Screening Result |
| AABA | Altaba Inc. | 29/3/2019 | Bullish | 74.12 | 8789 | MACD Cross-Up ZeroLine |
| AMRN | Amarin Corporation plc | 29/3/2019 | Bullish | 20.76 | 22659 | MACD Cross-Up Signal |
| BABA | Alibaba Group Holding Limited | 29/3/2019 | Bullish | 182.45 | 13841 | MACD Cross-Up ZeroLine |
| CNC | Centene Corporation | 29/3/2019 | Bullish | 53.1 | 7023 | MACD-H +ve Divergence |
| DAL | Delta Air Lines, Inc. | 29/3/2019 | Bullish | 51.65 | 9162 | MACD Cross-Up Signal |
| DIS | Walt Disney Company (The) | 29/3/2019 | Bullish | 111.03 | 15964 | MACD Cross-Up Signal |
| EBAY | eBay Inc. | 29/3/2019 | Bullish | 37.14 | 8636 | MACD Cross-Up Signal |
| GILD | Gilead Sciences, Inc. | 29/3/2019 | Bullish | 65.01 | 9477 | MACD-H +ve Divergence |
| JNJ | Johnson & Johnson | 29/3/2019 | Bullish | 139.79 | 7087 | MACD Cross-Up Signal |
| MGM | MGM Resorts International | 29/3/2019 | Bullish | 25.66 | 7182 | MACD +ve Divergence |
| MU | Micron Technology, Inc. | 29/3/2019 | Bullish | 41.33 | 35689 | MACD Cross-Up Signal |
| TJX | TJX Companies, Inc. (The) | 29/3/2019 | Bullish | 53.21 | 5888 | MACD Cross-Up Signal |
| WMT | Wal-Mart Stores, Inc. | 29/3/2019 | Bullish | 97.53 | 7439 | MACD-H +ve Divergence |
| MPC | Marathon Petroleum Corporation | 29/3/2019 | Bearish | 59.85 | 8245 | MACD Cross-Down ZeroLine |
| MRO | Marathon Oil Corporation | 29/3/2019 | Bearish | 16.71 | 8670 | MACD Cross-Down ZeroLine |
| SGH | SMART Global Holdings, Inc. | 29/3/2019 | Bearish | 19.2 | 6728 | MACD Cross-Down Signal |
| VZ | Verizon Communications Inc. | 29/3/2019 | Bearish | 59.13 | 16990 | MACD Cross-Down Signal |
| WU | Western Union Company (The) | 29/3/2019 | Bearish | 18.47 | 6065 | MACD-H -ve Divergence |
Moses U.S. Stock MACD Scan
AmiBroker Academy.com
Disclaimer
The above result is for illustration purpose. It is not meant to be used for buy or sell decision. We do not recommend any particular stocks. If particular stocks of such are mentioned, they are meant as demonstration of Amibroker as a powerful charting software and MACD. Amibroker can program to scan the stocks for buy and sell signals.
These are script generated signals. Not all scan results are shown here. The MACD signal should use with price action. Users must understand what MACD and price action are all about before using them. If necessary you should attend a course to learn more on Technical Analysis (TA) and Moving Average Convergence Divergence, MACD.
Once again, the website does not guarantee any results or investment return based on the information and instruction you have read here. It should be used as learning aids only and if you decide to trade real money, all trading decision should be your own.