22 March 2019
Thanks for visiting the site.
Free U.S. Stock MACD Screener
What is MACD?
MACD stands for Moving Average Convergence Divergence, common setting is (12,26,9)
MACD indicator is a trend trading system that makes up of 2 lines. The MACD Line (fast line) and MACD Signal Line (slow line).
1) When the MACD Line crosses over the MACD Signal Line the trend is bullish. When the MACD Line crosses below the MACD Signal the trend is bearish.
2) When the MACD Line crosses above zero line the trend is bullish. When the MACD line crosses below zero line the trend is bearish.
What is AmiBroker AFL?
AmiBroker AFL stands for AmiBroker Formula Language.
AmiBroker equips with a powerful formula language allowing you to write trading system rules, define your own indicators and custom commentaries, such as the MACD Screener Script here.
Read more on the following link, https://www.amibroker.com/guide/AFL.html.
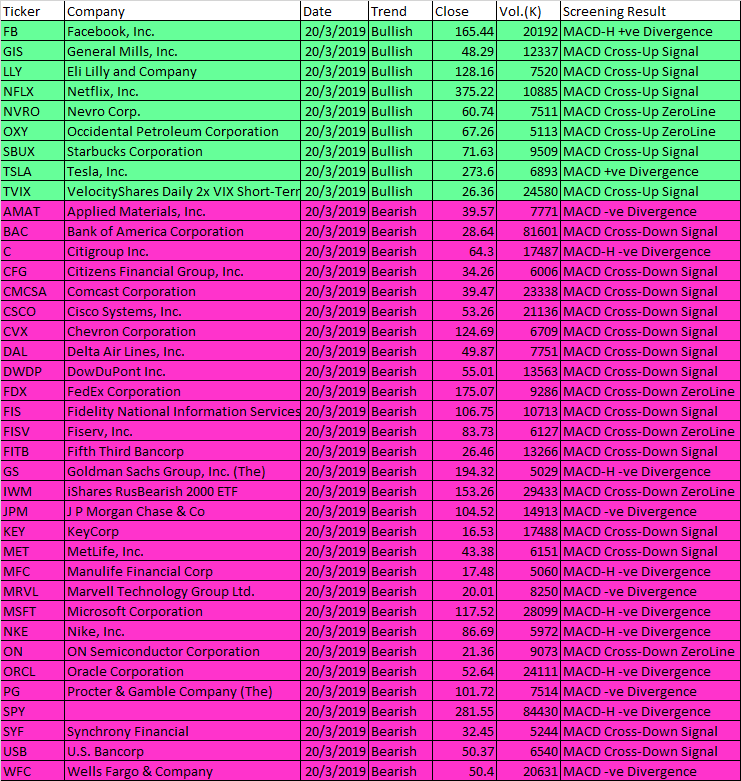
March 20, 2019 AFL Script Generated One-day U.S. Stock MACD Signals
The following are script generated One-day U.S. Stock Market MACD signals using the Powerful AmiBroker’s AFL.
The MACD Setting used is (8,17,9)
| Ticker | Company | Date | Trend | Close | Vol.(K) | Screening Result |
| FB | Facebook, Inc. | 20/3/2019 | Bullish | 165.44 | 20192 | MACD-H +ve Divergence |
| GIS | General Mills, Inc. | 20/3/2019 | Bullish | 48.29 | 12337 | MACD Cross-Up Signal |
| LLY | Eli Lilly and Company | 20/3/2019 | Bullish | 128.16 | 7520 | MACD Cross-Up Signal |
| NFLX | Netflix, Inc. | 20/3/2019 | Bullish | 375.22 | 10885 | MACD Cross-Up Signal |
| NVRO | Nevro Corp. | 20/3/2019 | Bullish | 60.74 | 7511 | MACD Cross-Up ZeroLine |
| OXY | Occidental Petroleum Corporation | 20/3/2019 | Bullish | 67.26 | 5113 | MACD Cross-Up ZeroLine |
| SBUX | Starbucks Corporation | 20/3/2019 | Bullish | 71.63 | 9509 | MACD Cross-Up Signal |
| TSLA | Tesla, Inc. | 20/3/2019 | Bullish | 273.6 | 6893 | MACD +ve Divergence |
| TVIX | VelocityShares Daily 2x VIX Short-Term ETN | 20/3/2019 | Bullish | 26.36 | 24580 | MACD Cross-Up Signal |
| AMAT | Applied Materials, Inc. | 20/3/2019 | Bearish | 39.57 | 7771 | MACD -ve Divergence |
| BAC | Bank of America Corporation | 20/3/2019 | Bearish | 28.64 | 81601 | MACD Cross-Down Signal |
| C | Citigroup Inc. | 20/3/2019 | Bearish | 64.3 | 17487 | MACD-H -ve Divergence |
| CFG | Citizens Financial Group, Inc. | 20/3/2019 | Bearish | 34.26 | 6006 | MACD Cross-Down Signal |
| CMCSA | Comcast Corporation | 20/3/2019 | Bearish | 39.47 | 23338 | MACD Cross-Down Signal |
| CSCO | Cisco Systems, Inc. | 20/3/2019 | Bearish | 53.26 | 21136 | MACD Cross-Down Signal |
| CVX | Chevron Corporation | 20/3/2019 | Bearish | 124.69 | 6709 | MACD Cross-Down Signal |
| DAL | Delta Air Lines, Inc. | 20/3/2019 | Bearish | 49.87 | 7751 | MACD Cross-Down Signal |
| DWDP | DowDuPont Inc. | 20/3/2019 | Bearish | 55.01 | 13563 | MACD Cross-Down Signal |
| FDX | FedEx Corporation | 20/3/2019 | Bearish | 175.07 | 9286 | MACD Cross-Down ZeroLine |
| FIS | Fidelity National Information Services, Inc. | 20/3/2019 | Bearish | 106.75 | 10713 | MACD Cross-Down Signal |
| FISV | Fiserv, Inc. | 20/3/2019 | Bearish | 83.73 | 6127 | MACD Cross-Down ZeroLine |
| FITB | Fifth Third Bancorp | 20/3/2019 | Bearish | 26.46 | 13266 | MACD Cross-Down Signal |
| GS | Goldman Sachs Group, Inc. (The) | 20/3/2019 | Bearish | 194.32 | 5029 | MACD-H -ve Divergence |
| IWM | iShares RusBearish 2000 ETF | 20/3/2019 | Bearish | 153.26 | 29433 | MACD Cross-Down ZeroLine |
| JPM | J P Morgan Chase & Co | 20/3/2019 | Bearish | 104.52 | 14913 | MACD -ve Divergence |
| KEY | KeyCorp | 20/3/2019 | Bearish | 16.53 | 17488 | MACD Cross-Down Signal |
| MET | MetLife, Inc. | 20/3/2019 | Bearish | 43.38 | 6151 | MACD Cross-Down Signal |
| MFC | Manulife Financial Corp | 20/3/2019 | Bearish | 17.48 | 5060 | MACD-H -ve Divergence |
| MRVL | Marvell Technology Group Ltd. | 20/3/2019 | Bearish | 20.01 | 8250 | MACD -ve Divergence |
| MSFT | Microsoft Corporation | 20/3/2019 | Bearish | 117.52 | 28099 | MACD-H -ve Divergence |
| NKE | Nike, Inc. | 20/3/2019 | Bearish | 86.69 | 5972 | MACD-H -ve Divergence |
| ON | ON Semiconductor Corporation | 20/3/2019 | Bearish | 21.36 | 9073 | MACD Cross-Down ZeroLine |
| ORCL | Oracle Corporation | 20/3/2019 | Bearish | 52.64 | 24111 | MACD-H -ve Divergence |
| PG | Procter & Gamble Company (The) | 20/3/2019 | Bearish | 101.72 | 7514 | MACD -ve Divergence |
| SPY | 20/3/2019 | Bearish | 281.55 | 84430 | MACD-H -ve Divergence | |
| SYF | Synchrony Financial | 20/3/2019 | Bearish | 32.45 | 5244 | MACD Cross-Down Signal |
| USB | U.S. Bancorp | 20/3/2019 | Bearish | 50.37 | 6540 | MACD Cross-Down Signal |
| WFC | Wells Fargo & Company | 20/3/2019 | Bearish | 50.4 | 20631 | MACD -ve Divergence |
Moses U.S. Stock MACD Scan
AmiBroker Academy.com
Disclaimer
The above result is for illustration purpose. It is not meant to be used for buy or sell decision. We do not recommend any particular stocks. If particular stocks of such are mentioned, they are meant as demonstration of Amibroker as a powerful charting software and MACD. Amibroker can program to scan the stocks for buy and sell signals.
These are script generated signals. Not all scan results are shown here. The MACD signal should use with price action. Users must understand what MACD and price action are all about before using them. If necessary you should attend a course to learn more on Technical Analysis (TA) and Moving Average Convergence Divergence, MACD.
Once again, the website does not guarantee any results or investment return based on the information and instruction you have read here. It should be used as learning aids only and if you decide to trade real money, all trading decision should be your own.