April 11, 2019
Thanks for visit the site here. Hope you find the read interesting.
Think think got more things.
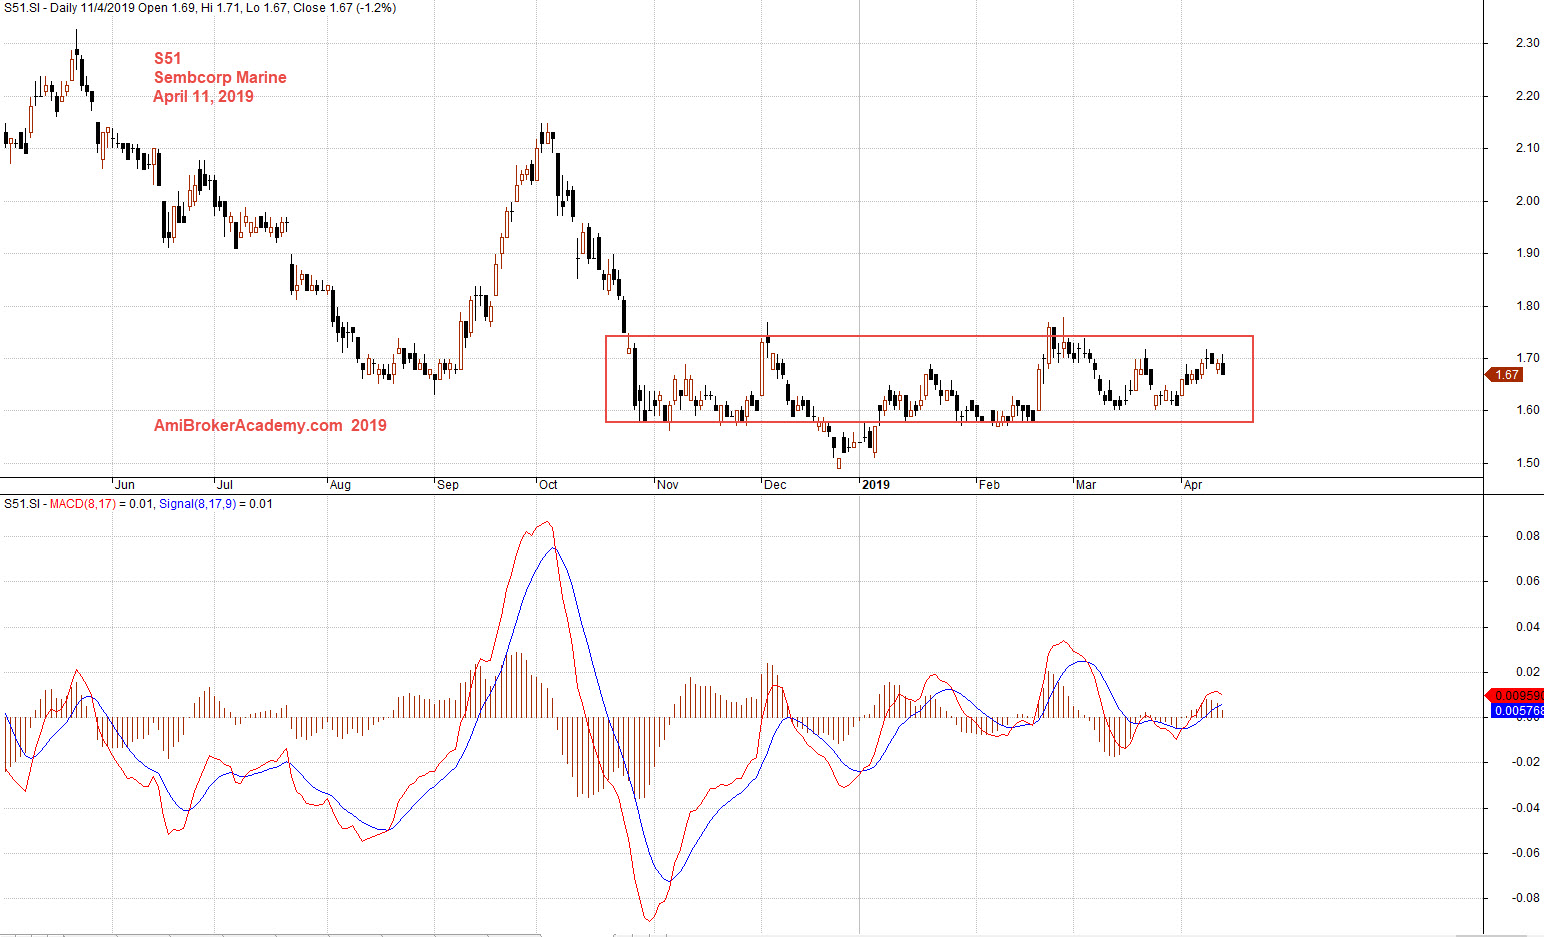
S51 Sembcorp Marine Stock Charting
Study Sembcorp Marine chart and MACD.
See chart, picture worth a thousand words. The stock after the speak and try again but fail to reach the same high. Sembcorp Marine stock price begin to go lower, the next is sideways.
It is always good to look at indicator such as MACD.
You see MACD begin to draw near zeroline, see chart.
Trade with eyes open.
Moses Stock Chart Analysis
AmiBrokerAcademy.com
Disclaimer
The above result is for illustration purpose. It is not meant to be used for buy or sell decision. We do not recommend any particular stocks. If particular stocks of such are mentioned, they are meant as demonstration of Amibroker as a powerful charting software and MACD. Amibroker can program to scan the stocks for buy and sell signals.
These are script generated signals. Not all scan results are shown here. The MACD signal should use with price action. Users must understand what MACD and price action are all about before using them. If necessary you should attend a course to learn more on Technical Analysis (TA) and Moving Average Convergence Divergence, MACD.
Once again, the website does not guarantee any results or investment return based on the information and instruction you have read here. It should be used as learning aids only and if you decide to trade real money, all trading decision should be your own.