4 January, 2020
Welcome to AmiBrokerAcademy.com. Thanks for visiting the site.
Choose What You Want – Two Sides of a Coin – Head or Tail
Choose to live what you want. A Happy Life or …
Anyway you are going to survival on both great and bad year, continue to trade the way you are. Have fun!
Enjoy! Happy New Year!
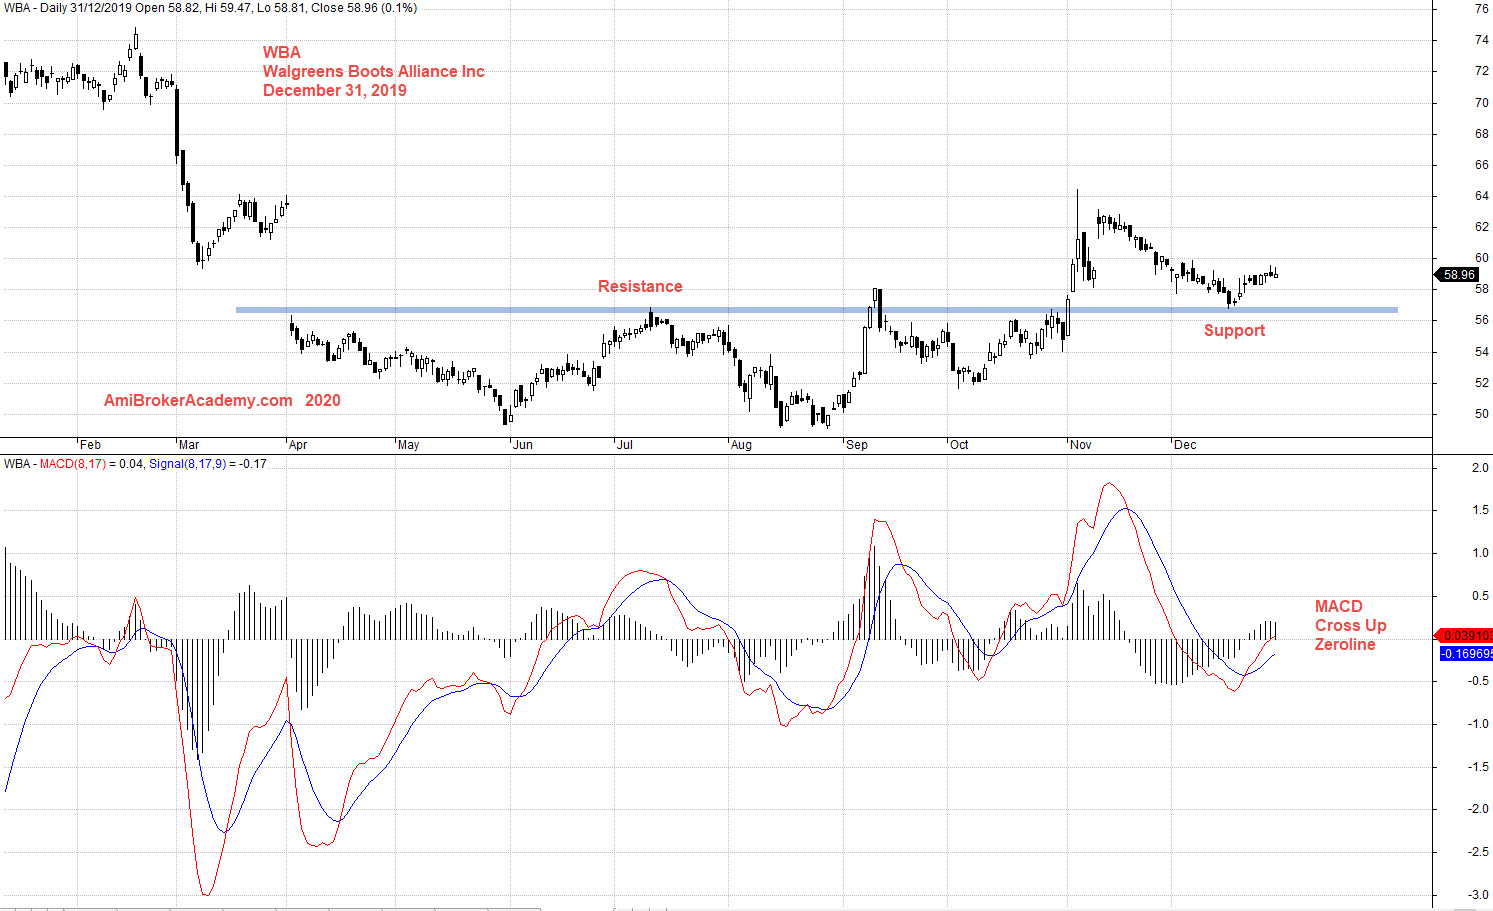
WBA Walgreens Boots Alliance Inc MACD Stock Charting
Study Walgreens Boots Alliance Inc stock chart price action and MACD.
Look left and think right. Manage your expectation.
See chart, picture worth a thousand words.
Zoom in, and see the price action after the fall at the start of 2019, and price action get resisted and now resistance turns support, see chart.
Will price action completed its bear reversal, and begin to go higher. Will see.
Trade with eyes open.
Moses Stock Observation
AmiBrokerAcademy.com
Disclaimer
The above result is for illustration purpose. It is not meant to be used for buy or sell decision. We do not recommend any particular stocks. If particular stocks of such are mentioned, they are meant as demonstration of Amibroker as a powerful charting software and MACD. Amibroker can program to scan the stocks for buy and sell signals.
These are script generated signals. Not all scan results are shown here. The MACD signal should use with price action. Users must understand what MACD and price action are all about before using them. If necessary you should attend a course to learn more on Technical Analysis (TA) and Moving Average Convergence Divergence, MACD.
Once again, the website does not guarantee any results or investment return based on the information and instruction you have read here. It should be used as learning aids only and if you decide to trade real money, all trading decision should be your own.