30 June 2021
Welcome!
Welcome to AmiBroker Academy dot com, amibrokeracademy.com.
We will study Bitcoin Crypto price action using different tools, besides MACD indicator.
We read what the price action tell us, ie Picture worth a thousand words.
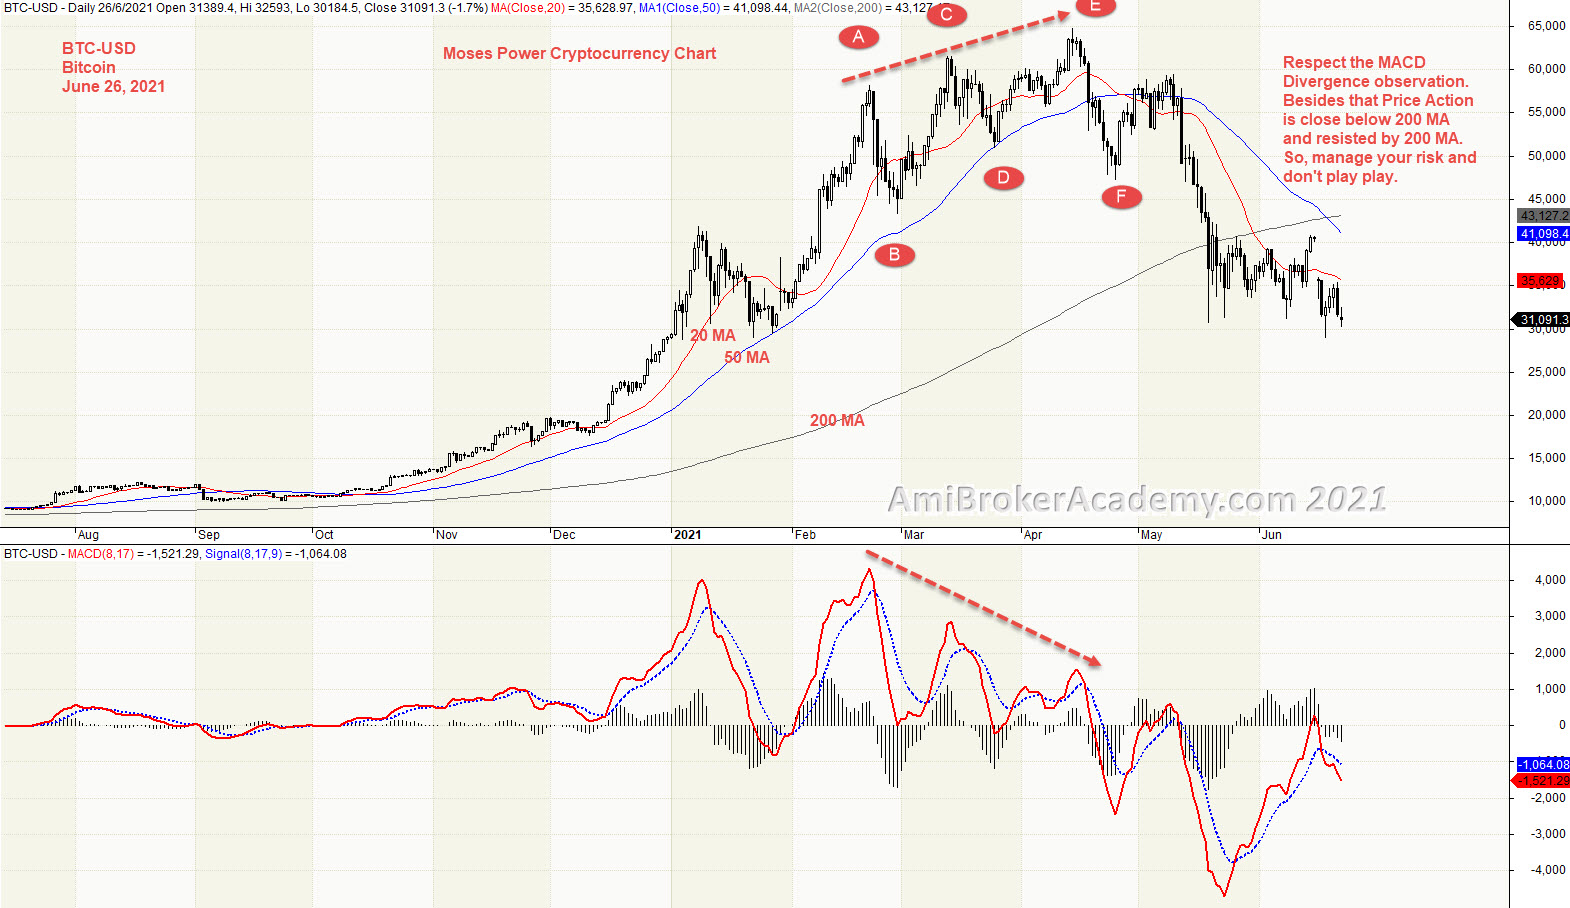
BTC-USD | Bitcoin CryptoCurrency and MACD Divergence
We see price action continues to go higher before the price action close below the last two higher low, and suddenly the BTC lost the energy to push price action higher then the last high. Remember all these can not come without any early signals. If you look down to MACD, we will see MACD forms lower high. MACD Divergence. Trade with what you see. Manage your risk.
Don’t take MACD information lightly.
Moses Power Charting
Official AmiBrokerAcademy.com Charting
Disclaimer
The above result is for illustration purpose. It is not meant to be used for buy or sell decision. We do not recommend any particular stocks. If particular stocks of such are mentioned, they are meant as demonstration of Amibroker as a powerful charting software and MACD. Amibroker can program to scan the stocks for buy and sell signals.
These are script generated signals. Not all scan results are shown here. The MACD signal should use with price action. Users must understand what MACD and price action are all about before using them. If necessary you should attend a course to learn more on Technical Analysis (TA) and Moving Average Convergence Divergence, MACD.
Once again, the website does not guarantee any results or investment return based on the information and instruction you have read here. It should be used as learning aids only and if you decide to trade real money, all trading decision should be your own.
We learn from many past and present great traders. Kudo to these master.