14 July, 2019
Welcome to AmiBrokerAcademy.com. Thanks for visiting the site.
Bitcoin has became hot again recently. See chart, it has came out of the low. Therefore we would study bitcoin from number of the chart analysis view point. Remember, we are just providing you a learning opportunity. We do not suggest any buy or sell opportunity. Even if we study sell or buy it is just a language expression and not action. Trade with your eyes open and manage your own capital risk.
Just to share with you a personal experience. I was pulled into a organization to help them to transform, share options was an instrument to attrack and retain talent. As you know win or lost is all depending on timing, as by the time I join the company I miss the before IPO timeframe, as I have to own the share at market price. That is not too bad, but the stock price has also got from initial offering price to peak and deep.
The price has returned to near IPO price. One day I walked pass by boss office. He stop me and said, have you track the stock price recently. I has yes. He then said, this is a good time to buy in as the stock price is now at good value. I told him I do not have cash to do that. I look at me and said, go and get a bank loan to buy.
Lucky, very lucky I did not follow his suggestion. I did not take a loan or buy any. But I told my wife about the incident, my wife actually bought in some stock.
The true was at the end the stock price deep further, and only left with half of the IPO price.
The the moral of lesson, is manage your own risk, and your own capital. Trading is only either right or wrong. even when the price goes sideways. If you can not hold the price. You are still in a lost. So again. trade with eyes open and manage your risk.
Let continue to study Bitcoin in a few charting view point. Have fun!
BTC-USD Bitcoin Stock Charting
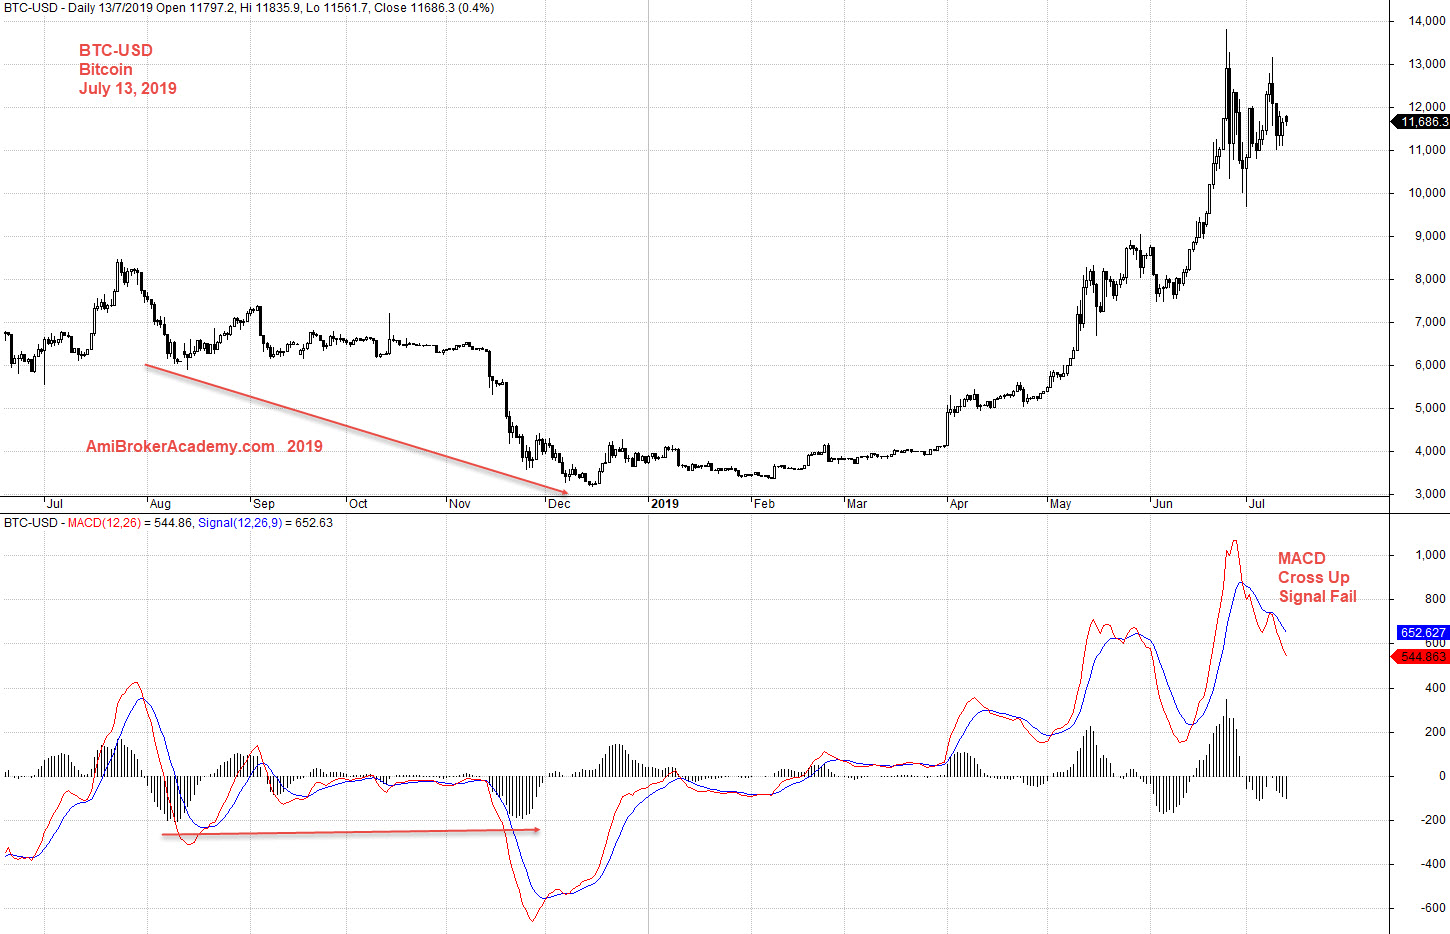
Study Bitcoin Stock chart and MACD.
See chart, picture worth a thousand words.
From MACD indicator, we see a positive divergence. For those can not wait and showhand, they were be very very unhappy. As the price action move sideways for four months before goes up. Because can you hold on to four thousand dollars a bitcoin for four month? You may be alright, but many can not. Those institution probably get to explain many round to their investor until find no more excuses.
Finally the price really take off. Now the MACD signal has reject the close up again. So, what’s next? From the indicator, you might want to stand a side and let the push build enough energy before it take off again.
Manage your risk.
Trade with your eyes open.
Many may miss this posting, as what MACD again. Have fun!
Moses Stock Observation
AmiBrokerAcademy.com
Disclaimer
The above result is for illustration purpose. It is not meant to be used for buy or sell decision. We do not recommend any particular stocks. If particular stocks of such are mentioned, they are meant as demonstration of Amibroker as a powerful charting software and MACD. Amibroker can program to scan the stocks for buy and sell signals.
These are script generated signals. Not all scan results are shown here. The MACD signal should use with price action. Users must understand what MACD and price action are all about before using them. If necessary you should attend a course to learn more on Technical Analysis (TA) and Moving Average Convergence Divergence, MACD.
Once again, the website does not guarantee any results or investment return based on the information and instruction you have read here. It should be used as learning aids only and if you decide to trade real money, all trading decision should be your own.