August 24, 2017
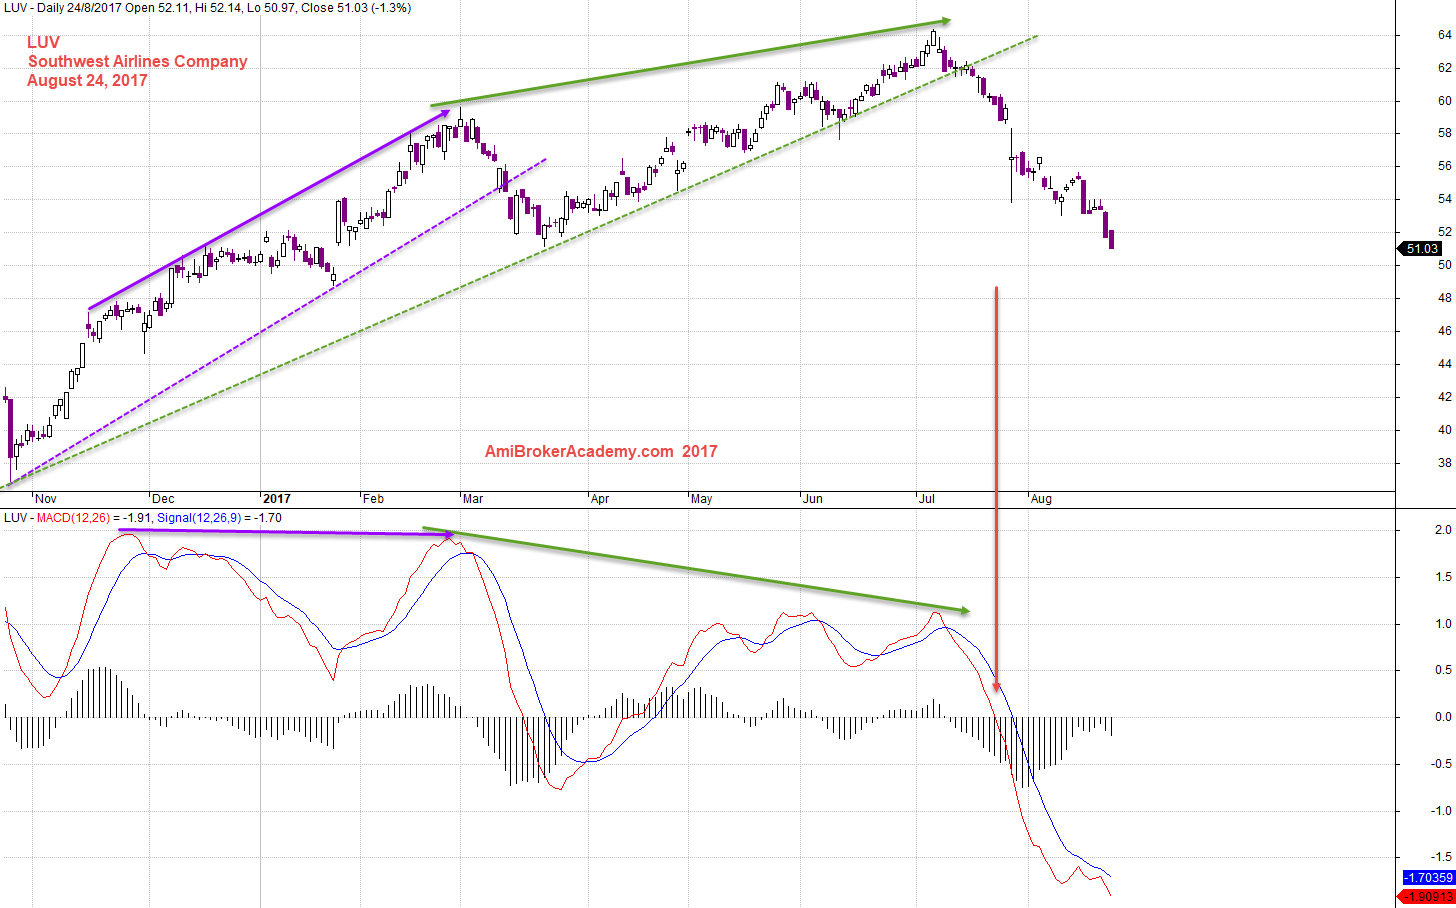
LUV Southwest Airlines Company and MACD Signals
See chart for more, picture worth a thousand words.
Share price forms higher high, MACD signal forms lower high, divergence.
Connect the low and draw a trendline, we expect the price to breakout below the trendline. If you can remember and always believe, all setup can fail. You see the first divergence actually fail. The share price continue to form higher high, and MACD signal continue to form lower high. Again, we connect the low and draw a trendline. We again expect the stock price to breakout below the trendline. Short again. This time round, looks okay.
However, no one can guarantee, so open your eyes big.
August 24, 2017 Southwest Airlines Company and MACD Signals
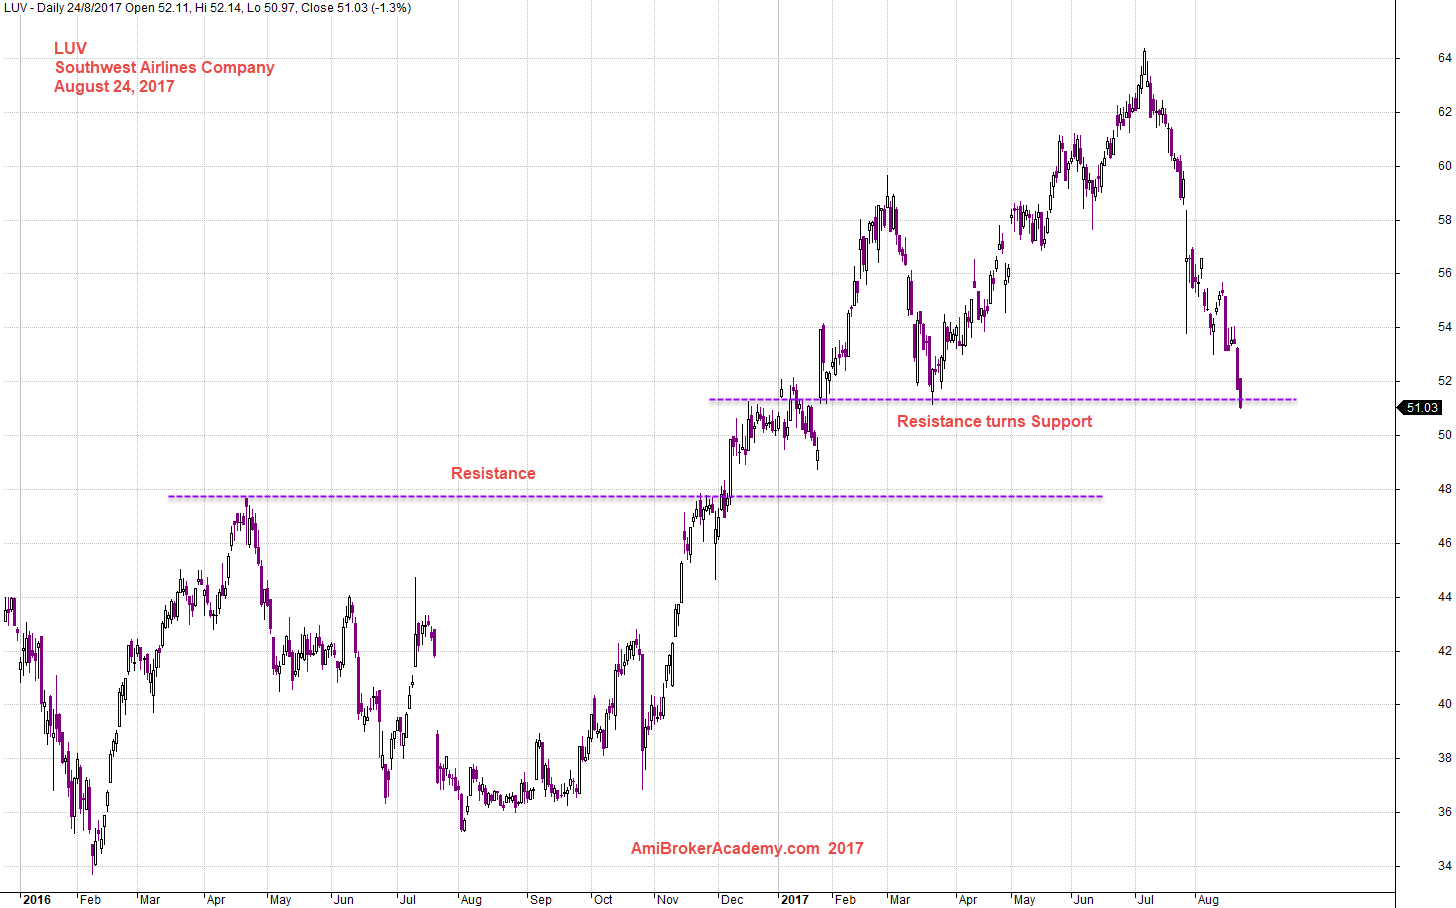
LUV Southwest Airlines Company and Support Resistance
Picture worth a thousand words. See chart for more.
Resistance get resisted again, and resistance turns support.
Can the support hold the price?
August 24, 2017 Southwest Airlines Company and Support Resistance
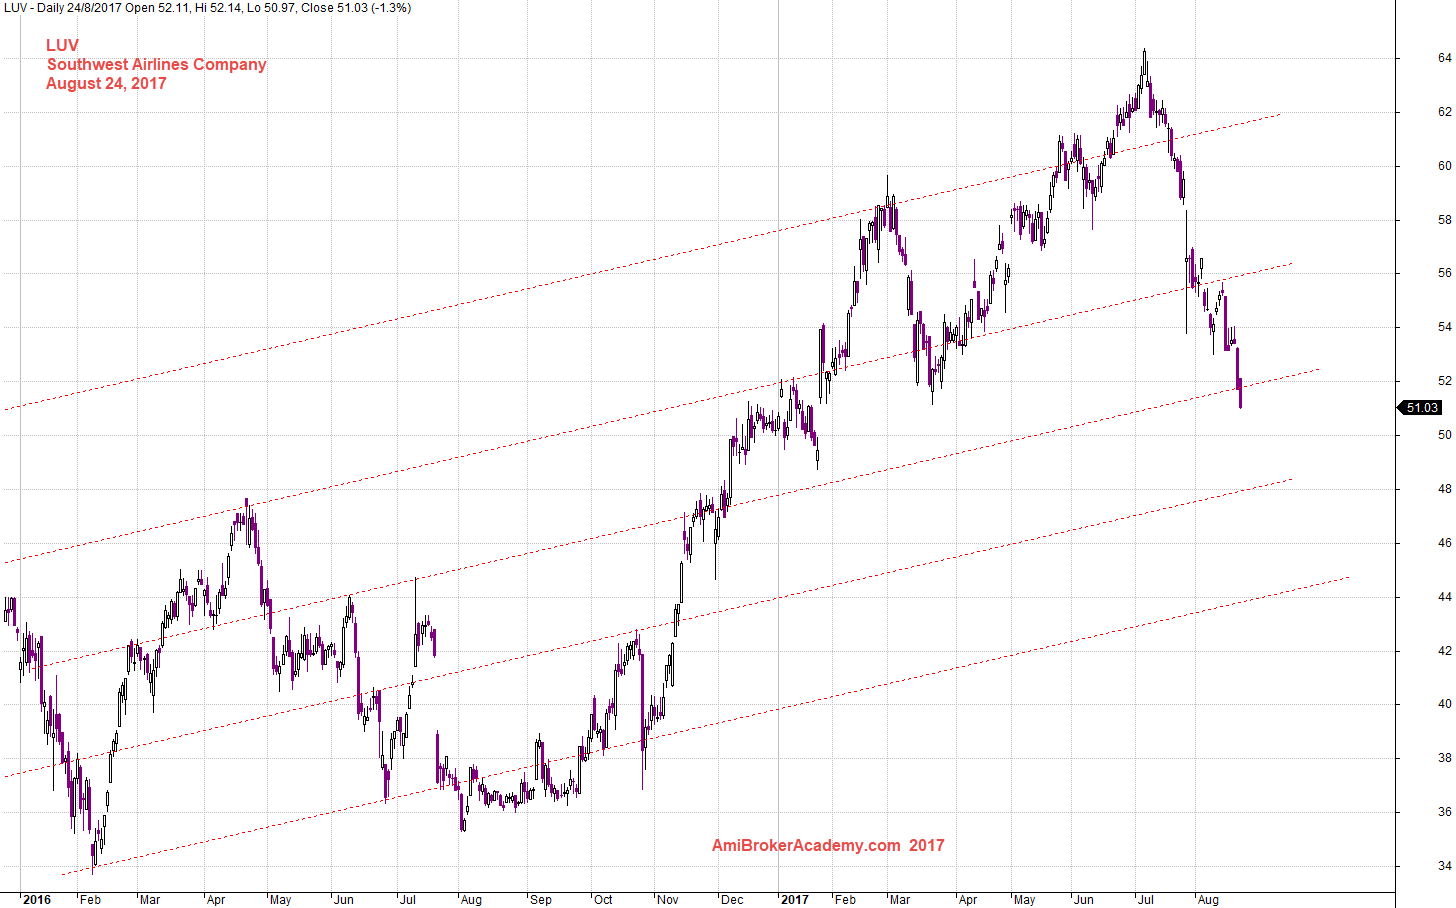
LUV Southwest Airlines Company and Channel
Picture worth a thousand words. You can see the price travel in layers. See chart for more.
August 24, 2017 Southwest Airlines Company and Channel
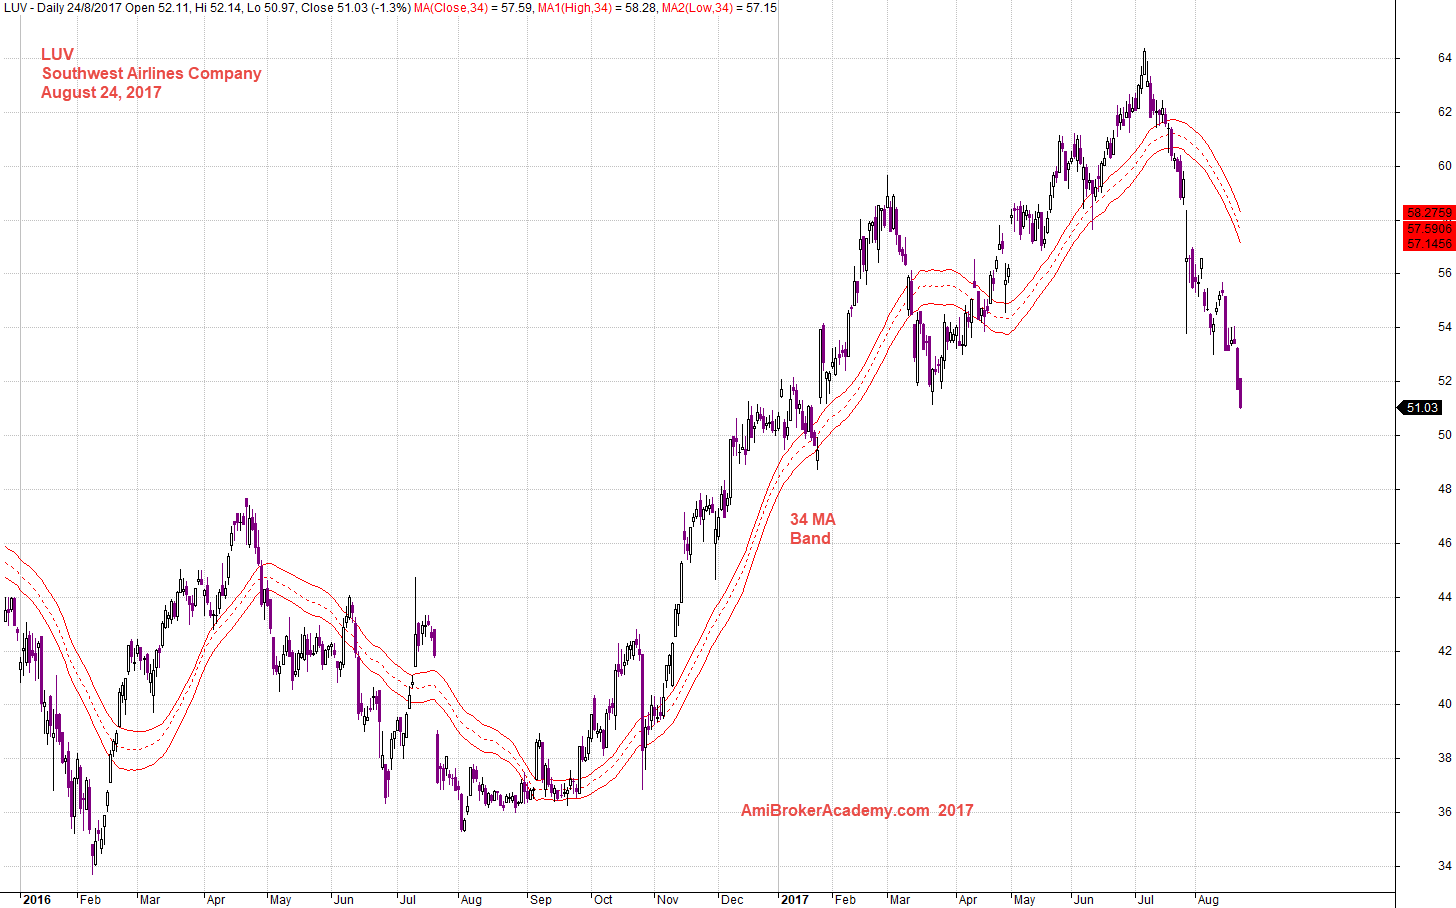
LUV Southwest Airlines Company and 34 MA Band
Picture worth a thousand words. Share price crossed up MA, cross down MA, … finally the share price crosses down MA again.
The band is pointing between four to six o’clock direction, Bearish, very bearish.
August 24, 2017 Southwest Airlines Company and 34 MA Band
Thanks for visit the site here. You could also find free MACD scan here in this site too.
Moses
AmiBrokerAcademy.com
Disclaimer
The above result is for illustration purpose. It is not meant to be used for buy or sell decision. We do not recommend any particular stocks. If particular stocks of such are mentioned, they are meant as demonstration of Amibroker as a powerful charting software and MACD. Amibroker can program to scan the stocks for buy and sell signals.
These are script generated signals. Not all scan results are shown here. The MACD signal should use with price action. Users must understand what MACD and price action are all about before using them. If necessary you should attend a course to learn more on Technical Analysis (TA) and Moving Average Convergence Divergence, MACD.
Once again, the website does not guarantee any results or investment return based on the information and instruction you have read here. It should be used as learning aids only and if you decide to trade real money, all trading decision should be your own.