5 October, 2018
Thanks for visiting the site.
FB Facebook Inc Daily Charting
Buy Support Sell Resistance
Buy Low Sell High
Study chart of Facebook Inc Daily stock price, picture worth a thousand words. We see stock price moves in ABCD down and goes low to 150 dollars in 2018. And the price action bounce in a narrow channel to the high near 220 dollars. Price action gap down, and continue to goes lower. Will low retest 150 dollars? Will see.
With the month high low, we can see a support zone near 160 region. See chart, picture worth a thousand words.
Trade with eyes open.
Manage your risk.
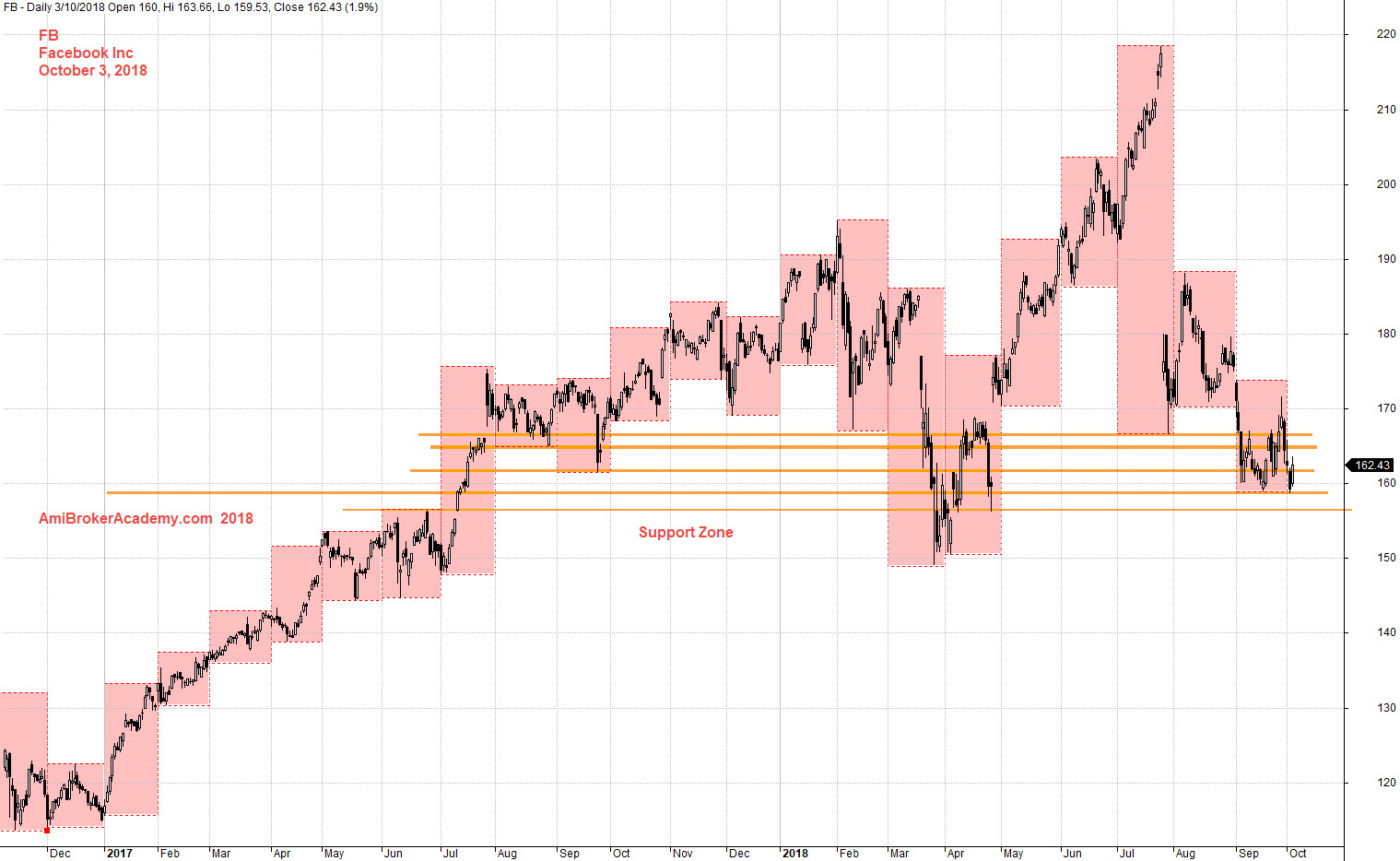
October 3, 2018 Facebook Inc and Month High Low
if you can see the full chart, “press Ctrl and -” to zoom out and see the entire chart.
Imagine we study Facebook Inc stock price using moving averages, see chart. Picture worth a thousand words.
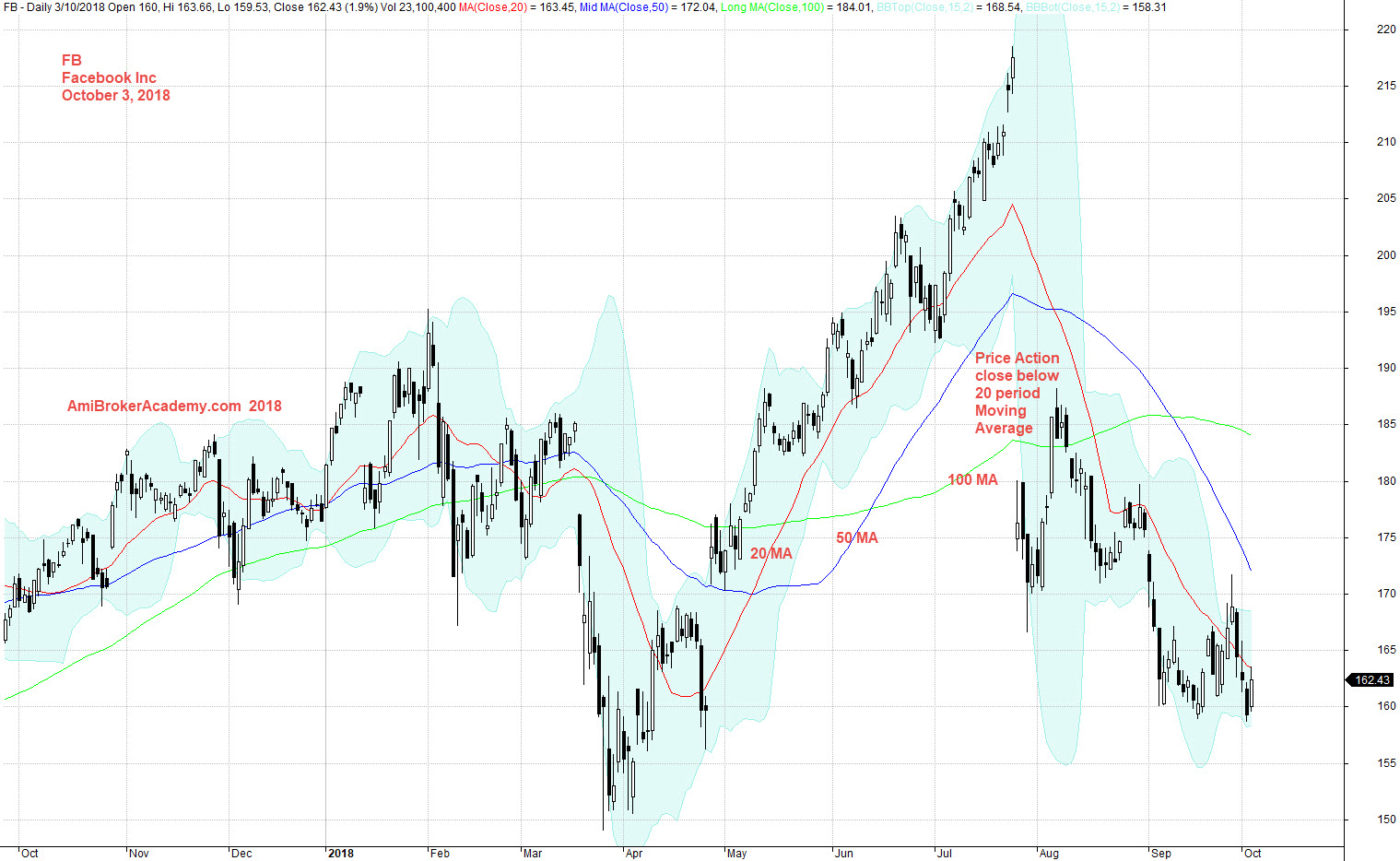
October 3, 2018 Facebook Inc and Moving Averages
For buy hold strategy, apply the buy low sell high, image we purchase the shares around 40 dollars, and waiting for the price action to close below bull trendline, and so far never happen. It is likely you still hold on to the shares. You will probably very happy.
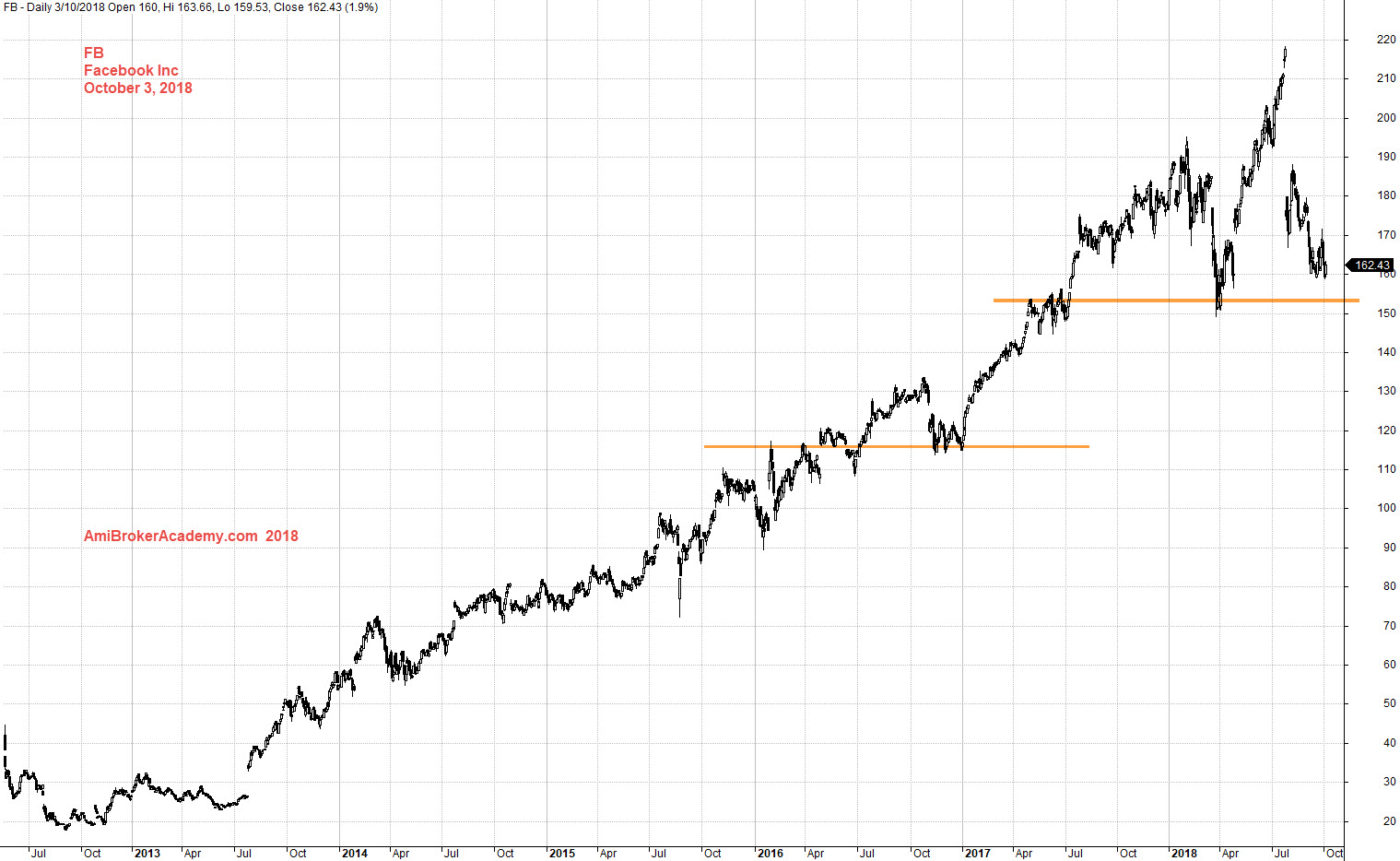
October 3, 2018 Facebook Inc and Support Resistance
If you add Stochastic indicator, see chart, picture worth a thousand words.
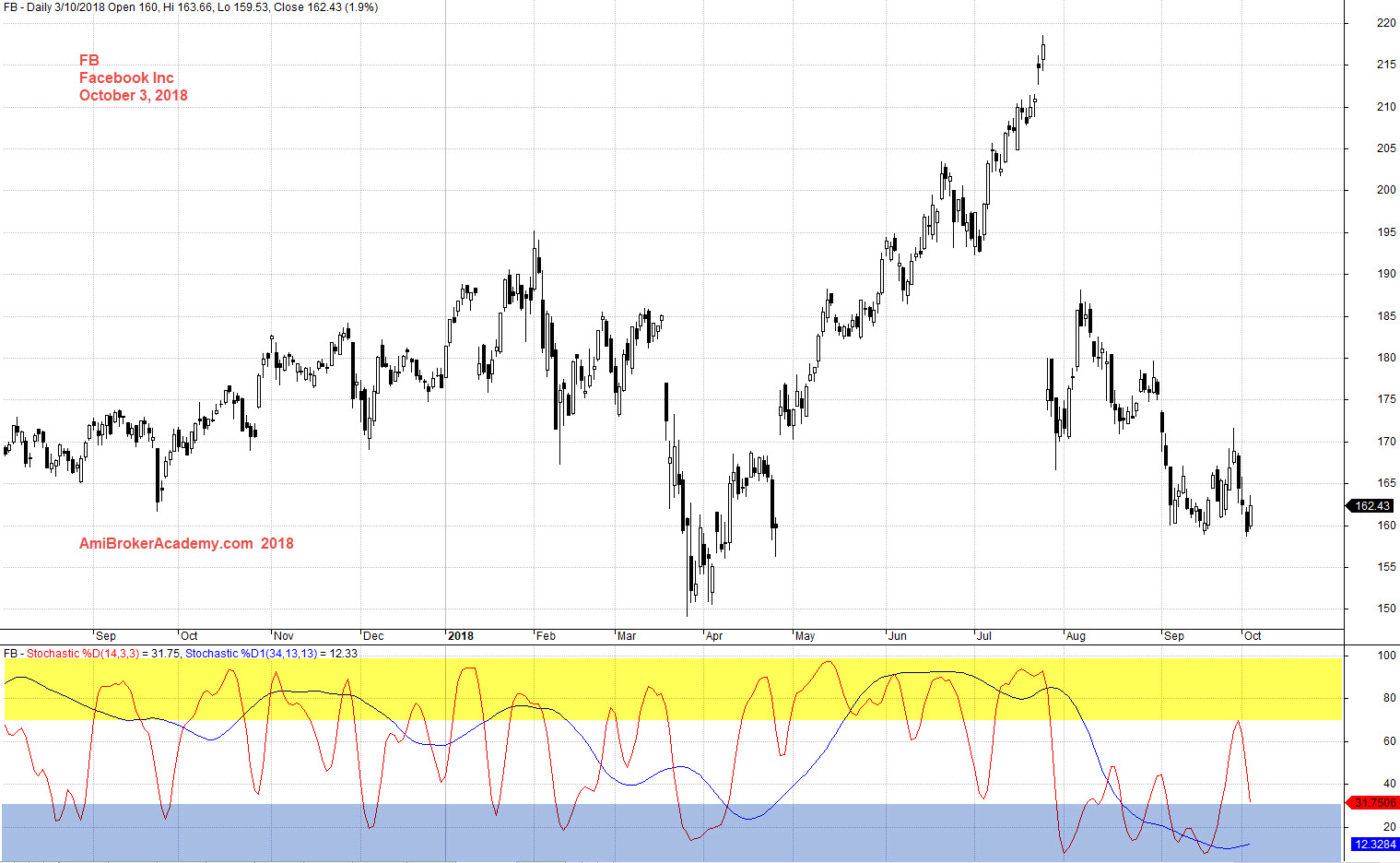
October 3, 2018 Facebook Inc and Stochastic
Moses US Stock Chart Analysis
AmiBrokerAcademy.com
Disclaimer
The above result is for illustration purpose. It is not meant to be used for buy or sell decision. We do not recommend any particular stocks. If particular stocks of such are mentioned, they are meant as demonstration of Amibroker as a powerful charting software and MACD. Amibroker can program to scan the stocks for buy and sell signals.
These are script generated signals. Not all scan results are shown here. The MACD signal should use with price action. Users must understand what MACD and price action are all about before using them. If necessary you should attend a course to learn more on Technical Analysis (TA) and Moving Average Convergence Divergence, MACD.
Once again, the website does not guarantee any results or investment return based on the information and instruction you have read here. It should be used as learning aids only and if you decide to trade real money, all trading decision should be your own.