January 21, 2018
Study DXY Dollar Index as Indicator Again
DXY is a very important indicator to gage the strength of US dollar.
US Stock Analysis
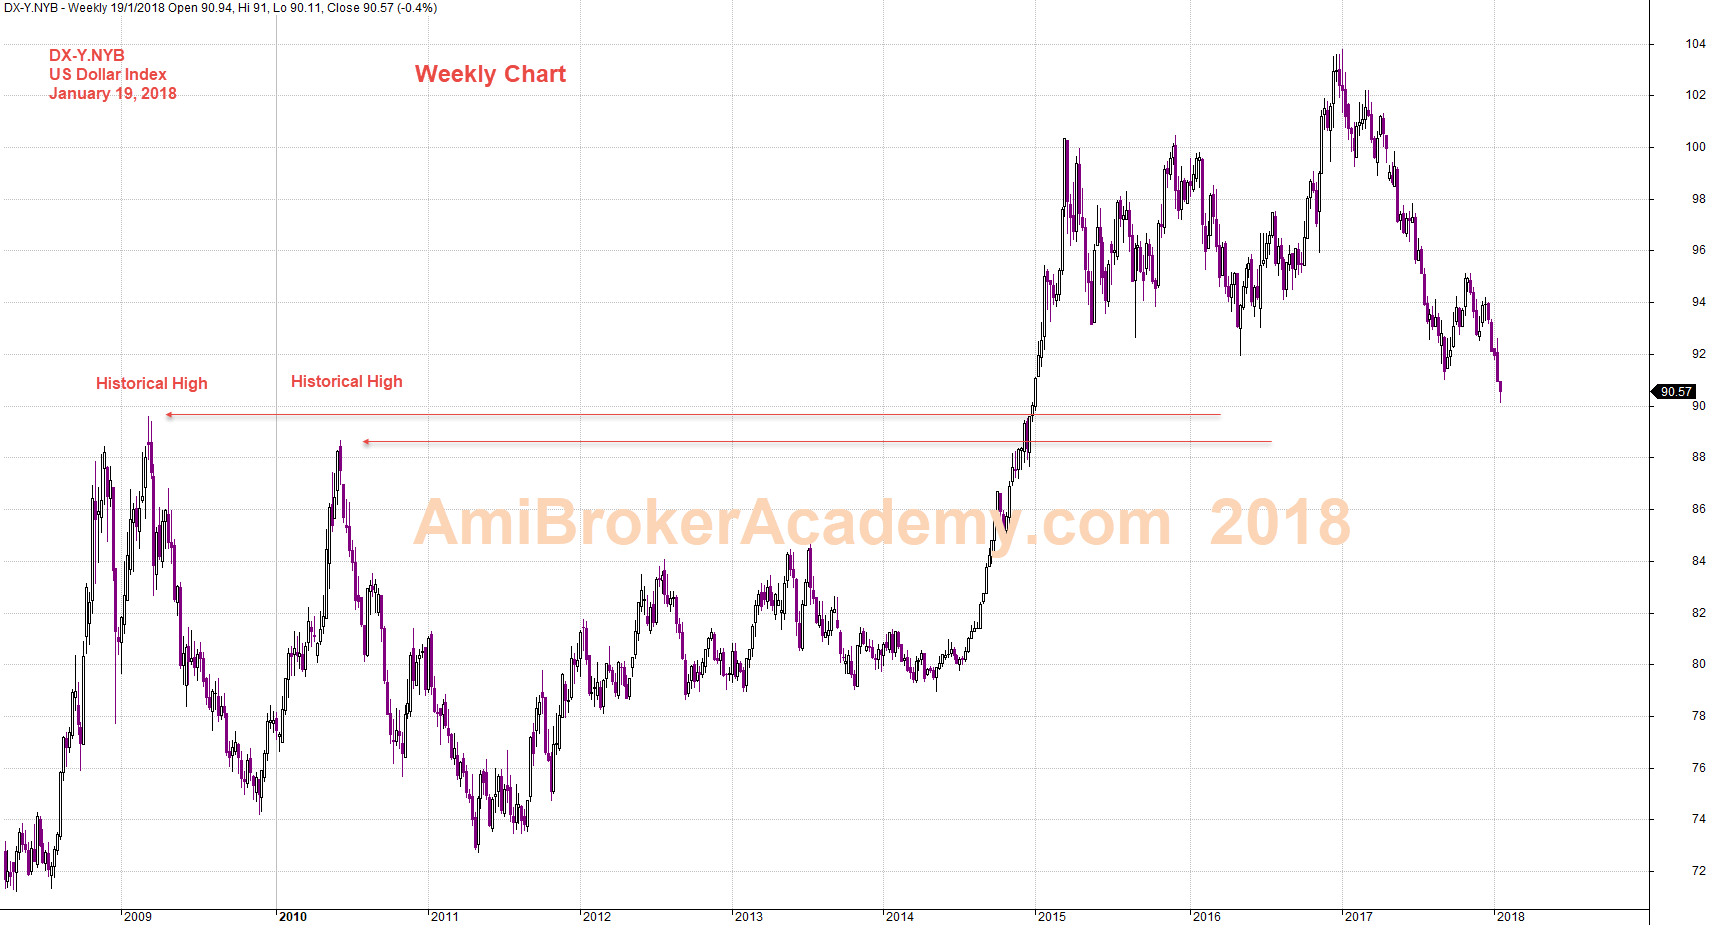
Dollar Index Historical High
Continue the last study the following chart, Dollar Index and plan your trade in 2018.
When look left and think right! You will easily spot two highs, 2010 high and 2009 high. When the Dollar index continue the down momentum, the likely level to hold the fall will be likely 2009 high, then next 2010 high.
In the technical analysis, we see a bearish ABCD pattern, completed AB leg, and BC leg. Now may be in the CD leg. When AB = CD, the CD leg will take 2013 high and 2012 high level. Will see.
Picture worth a thousand words, see chart and think, think think (think more) and got more things. Have fun!
Remember, in our last posting we said the Dollar Index is now retest the 2015 low, or 2014 high.
Manage your risk.
Powerful Chart Software – AmiBroker
The following chart is produced using AmiBroker charting software. It is a powerful chart software. You plot the stocks you are interested all in one chart, as long as you still could read them. See chart below.
January 19, 2018 US Dollar Index Weekly and Historical High
As said, think think got more things. If we map in the MACD indicator. What the indicator said?
Dollar Index and MACD
We see the MACD signal is below zeroline. Beaish bias.
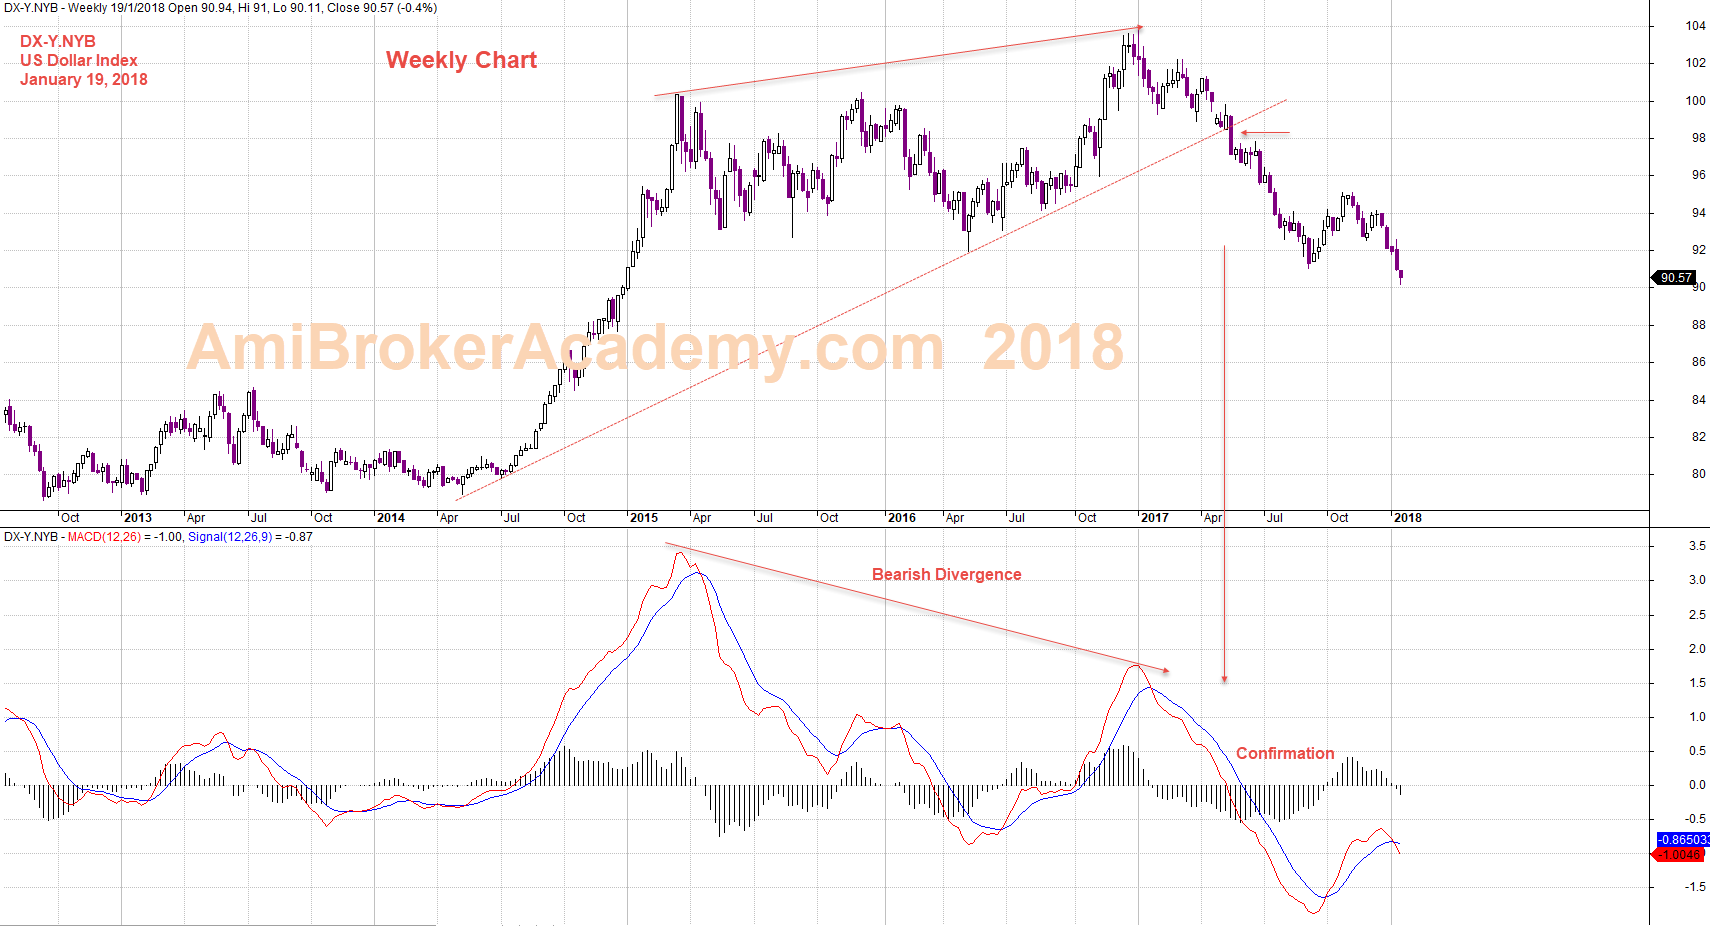
January 19, 2018 US Dollar Index Weekly and MACD
Moses
AmiBrokerAcademy.com
Disclaimer
The above result is for illustration purpose. It is not meant to be used for buy or sell decision. We do not recommend any particular stocks. If particular stocks of such are mentioned, they are meant as demonstration of Amibroker as a powerful charting software and MACD. Amibroker can program to scan the stocks for buy and sell signals.
These are script generated signals. Not all scan results are shown here. The MACD signal should use with price action. Users must understand what MACD and price action are all about before using them. If necessary you should attend a course to learn more on Technical Analysis (TA) and Moving Average Convergence Divergence, MACD.
Once again, the website does not guarantee any results or investment return based on the information and instruction you have read here. It should be used as learning aids only and if you decide to trade real money, all trading decision should be your own.