17 August, 2018
Thanks for visiting the site.
BABA Alibaba Group Holding and Stochastic
See stochastic for its slow and fast line, All are near the oversold region. So what? Trade with eyes open. Manager your risk.
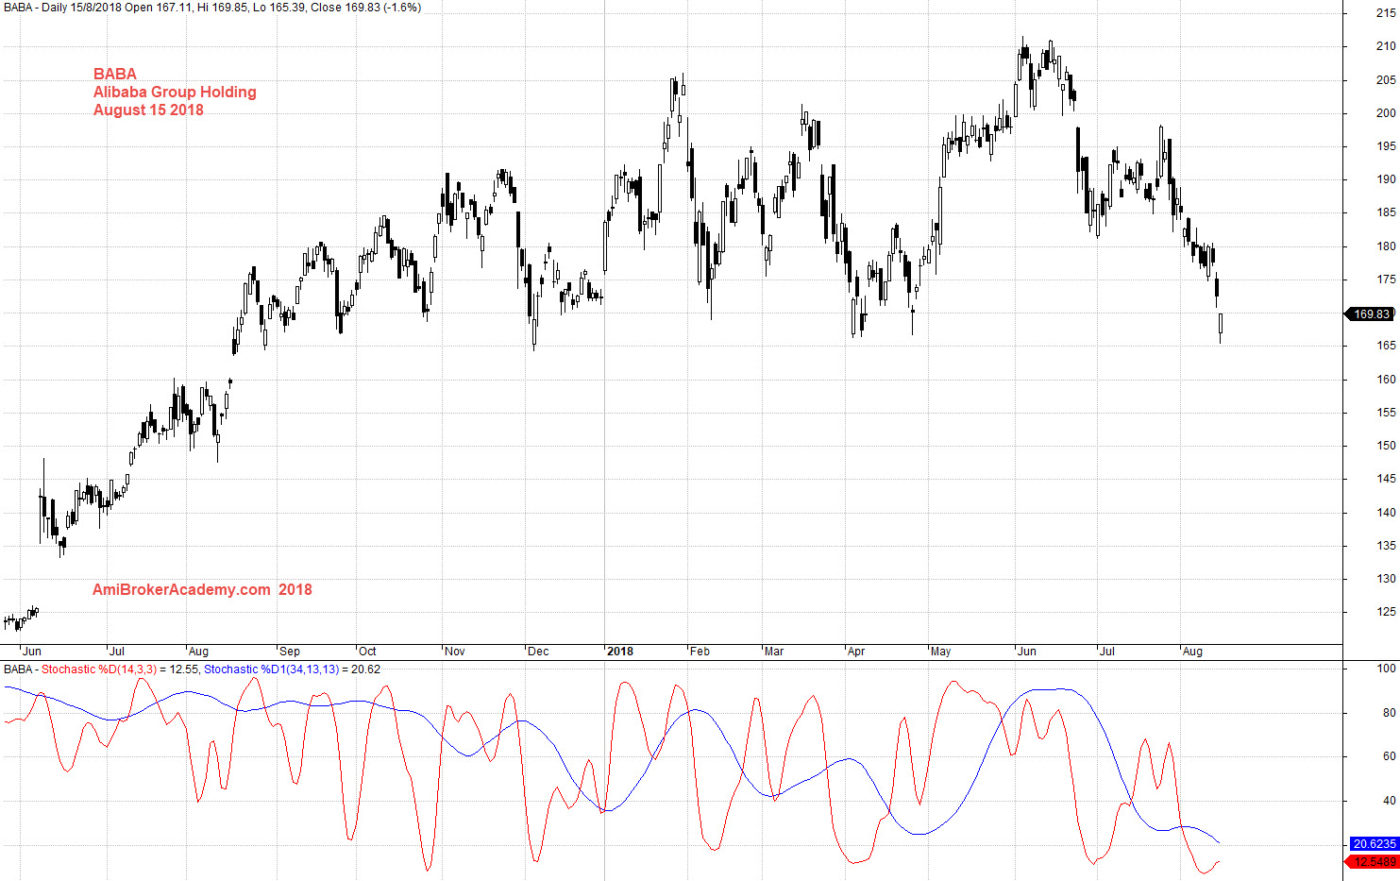
August 15, 2018 Alibaba Group Holding and Stochastic
BABA Alibaba Group Holding Price Action
See chart, the price action return to eight months low. Why? Because this is an important level for Alibaba stock. If your will look further to your left. You could see the price action was also near this region many time. Manager your risk.
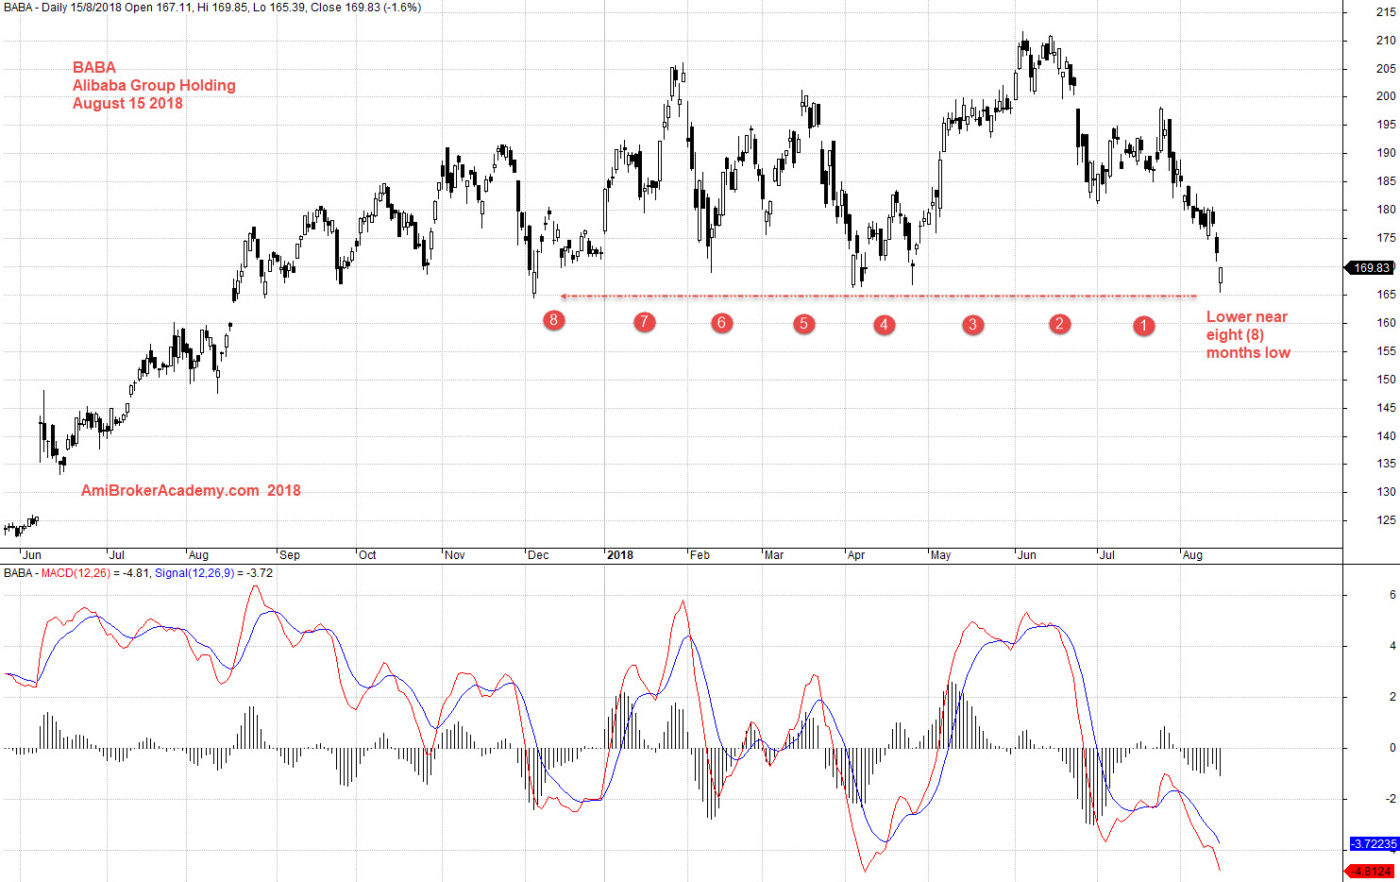
August 15, 2018 Alibaba Group Holding and MACD
BABA Alibaba Group Holding Support Resistance
See chart, picture worth a thousand words. The price action after tested near 166 region a few times, to be exact three times. So, 165 to 168 is an important level for BABA. Trade with eyes open.
Manage your risk.
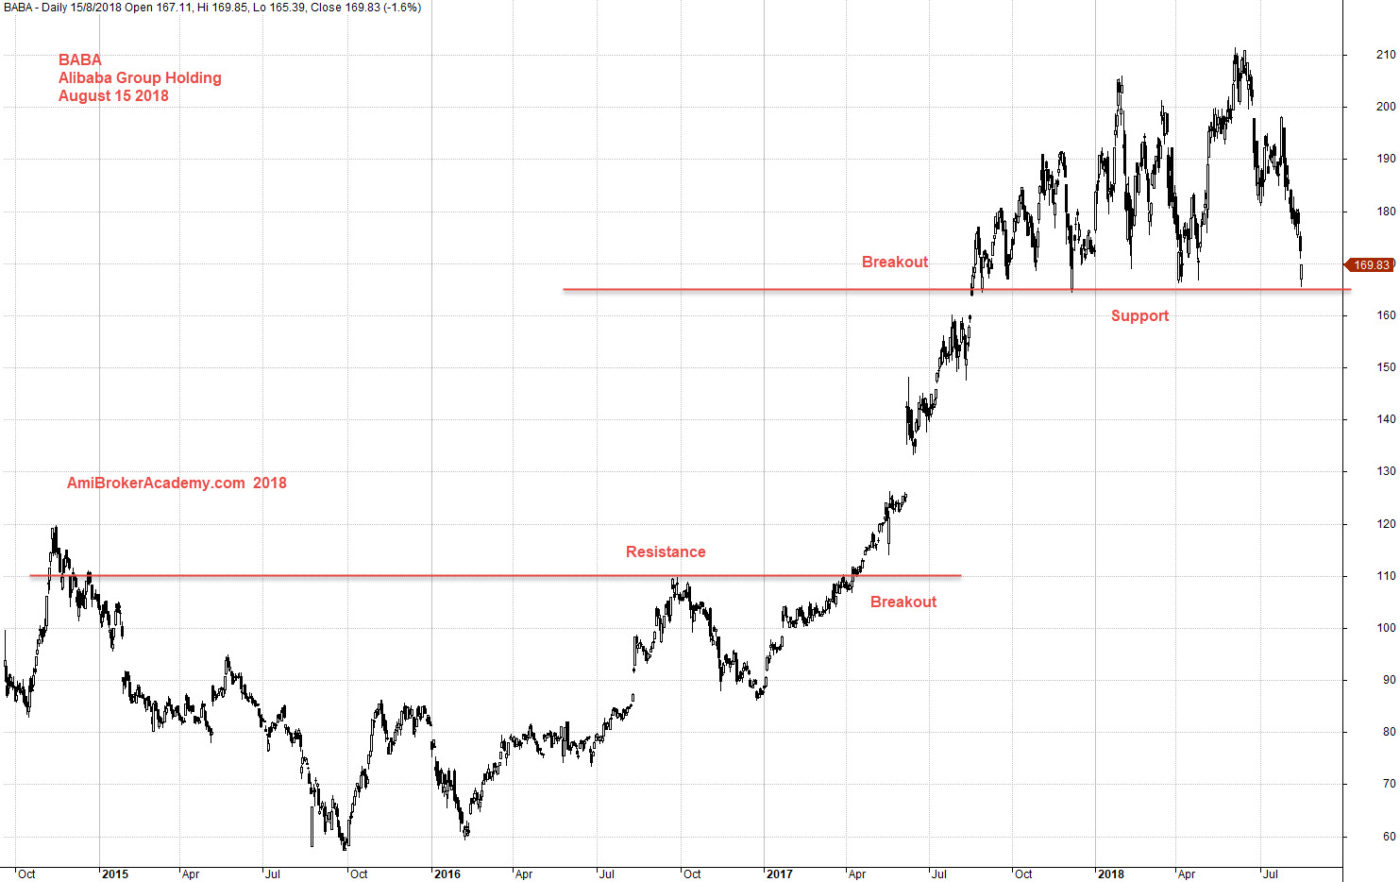
August 15, 2018 Alibaba Group Holding and Support Resistance
Moses US Stock Chart Analysis
AmiBrokerAcademy.com
Disclaimer
The above result is for illustration purpose. It is not meant to be used for buy or sell decision. We do not recommend any particular stocks. If particular stocks of such are mentioned, they are meant as demonstration of Amibroker as a powerful charting software and MACD. Amibroker can program to scan the stocks for buy and sell signals.
These are script generated signals. Not all scan results are shown here. The MACD signal should use with price action. Users must understand what MACD and price action are all about before using them. If necessary you should attend a course to learn more on Technical Analysis (TA) and Moving Average Convergence Divergence, MACD.
Once again, the website does not guarantee any results or investment return based on the information and instruction you have read here. It should be used as learning aids only and if you decide to trade real money, all trading decision should be your own.