27 April, 2018
Listen
Recently there are too many noises, or information in the market, so it is very difficult to know what are the information or news are telling the truth.
The truth about … the truth
Chart probably is the most truth, you can not lie about the stock market open, high, low and close. So, analyse the chart to know what the part is all about is better then listening to the analyse telling your how the market react certain policy.
Good trader proactively relies on the truth, the chart to tell them where the market is going.
The site here study the chart on the current, or recent market and tell you the information we gather. We tell you the pattern you can see, or pattern about to complete.
US Stock Chart Analysis
TSLA Tesla Inc and MACD
Picture worth a thousand words, study the following Tesla Inc stock chart with MACD indicator, we could easily identify the divergence signal. We could also see the price action react to the divergence signals.
However, overall this stock is continue to form lower high and lower low in 2018.
Manage your risk!
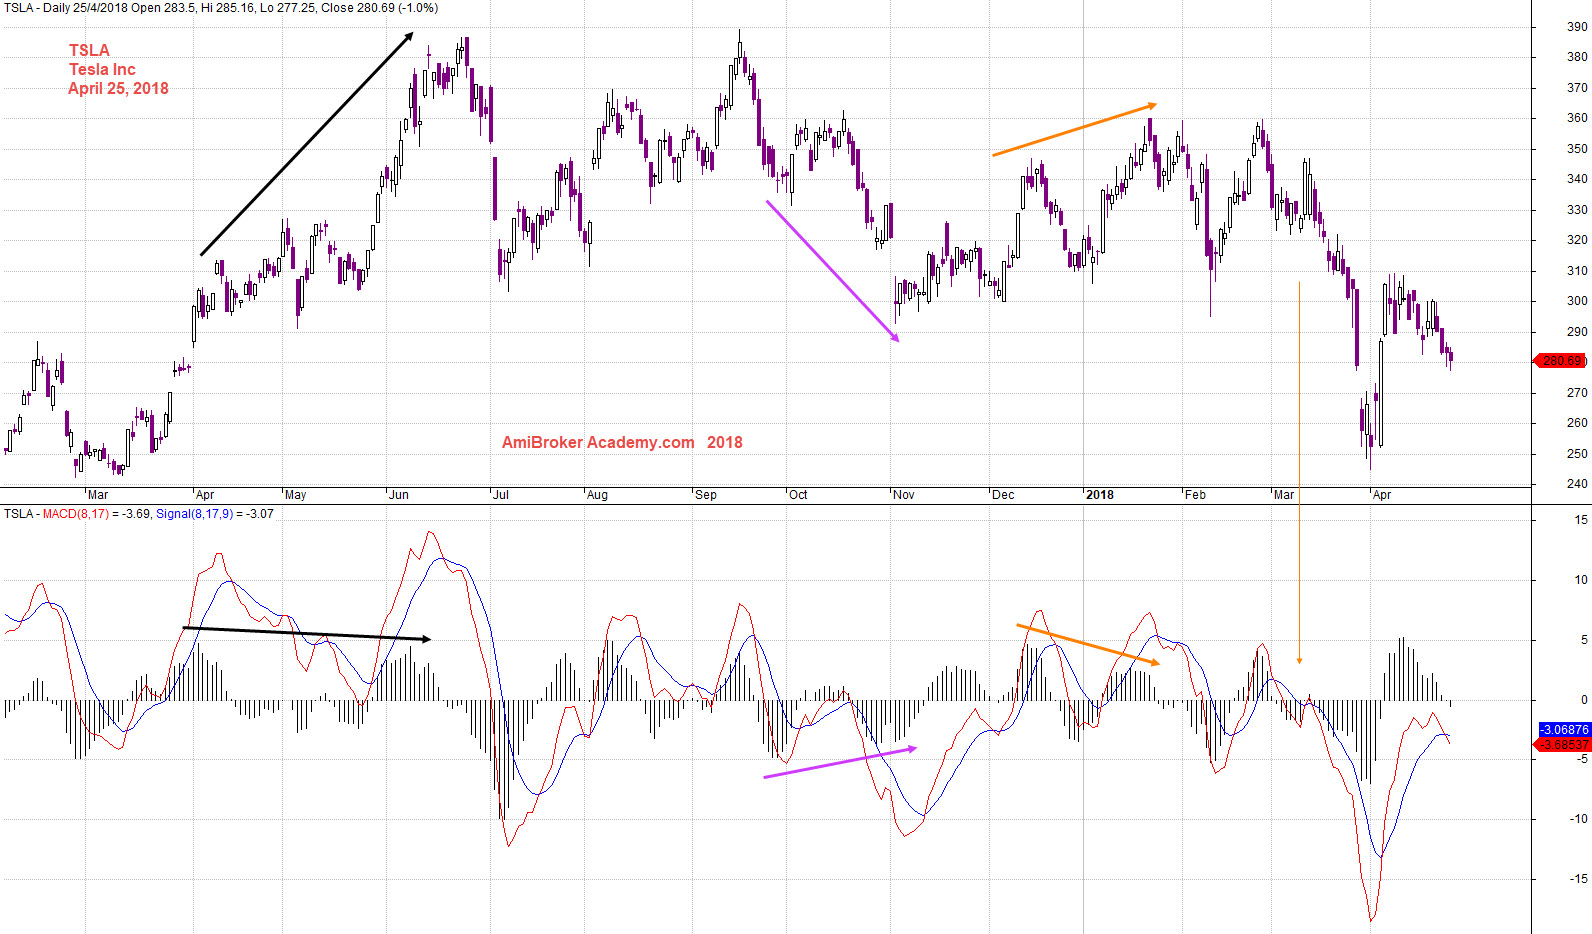
April 25, 2018 Tesla Inc and MACD
TSLA Tesla Inc and Fibonacci
Study Tesla stock price using Fibonacci, swing high to low and draw the Fibonacci Extension, we could easily see the price action get resisted at 61%, resisted by the 0%. The stock price breakout lower than 127% and get supported by 161%. So, this stock has fallen from 360 to nearly 240 in 2018. The stock was managed to hold, supported at 250. Can the stock price would go any further south for 2018, will see. The chart will tell the truth. See the stock price development for the next eight months. Manage your risk.
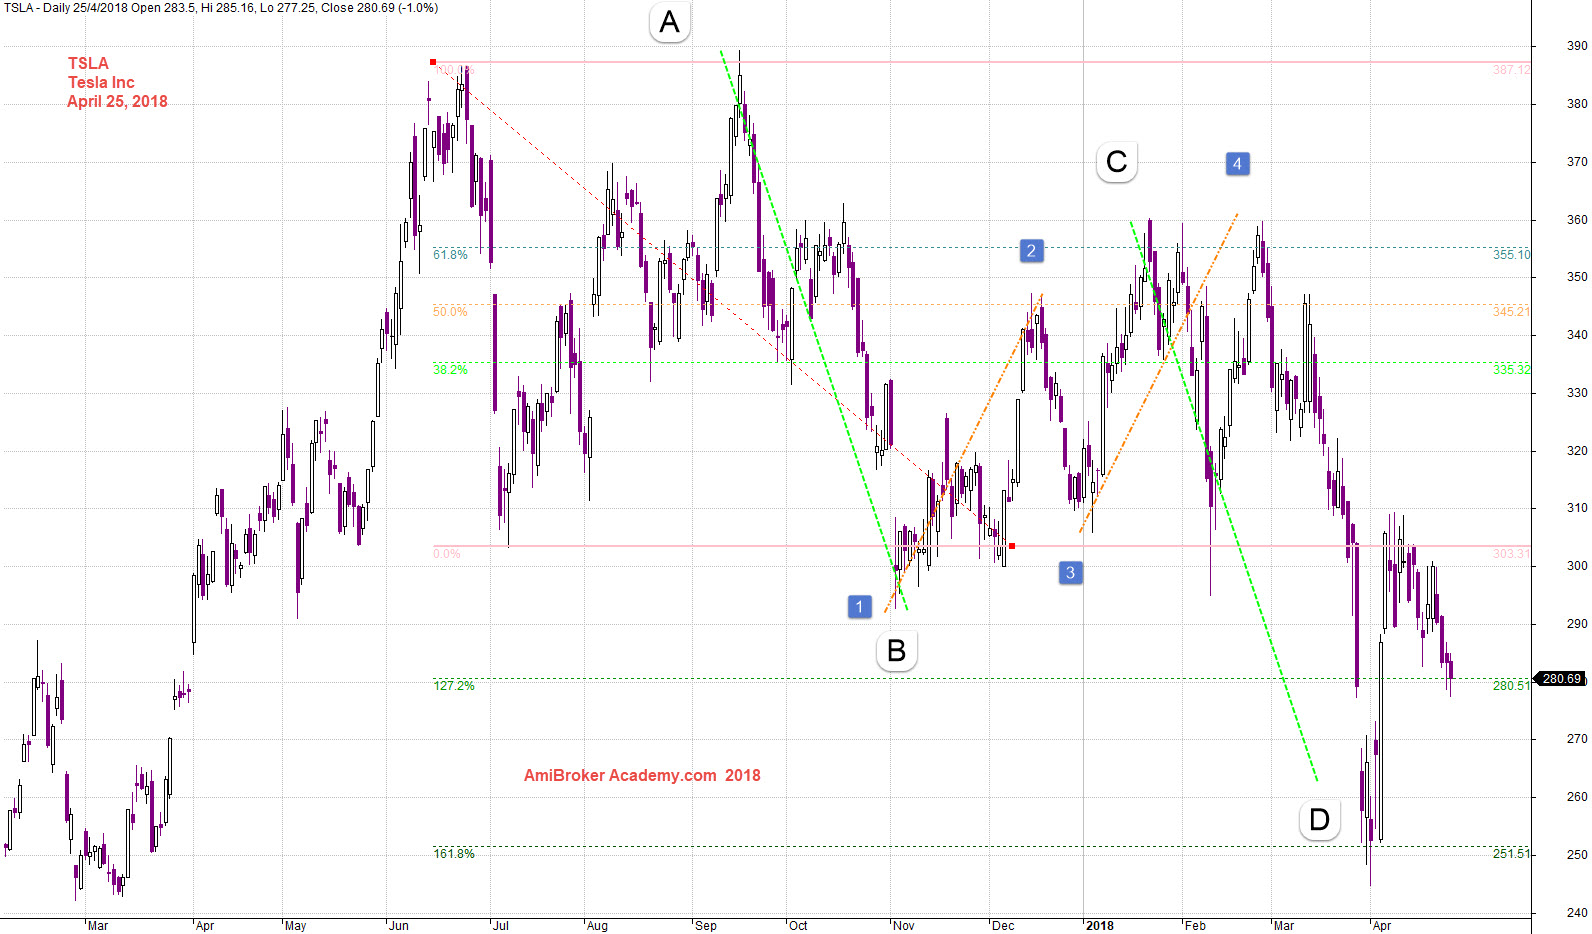
April 25, 2018 Tesla Inc and Fibo Extension High to Low
Moses US Stock Chart Analysis
AmiBrokerAcademy.com
Disclaimer
The above result is for illustration purpose. It is not meant to be used for buy or sell decision. We do not recommend any particular stocks. If particular stocks of such are mentioned, they are meant as demonstration of Amibroker as a powerful charting software and MACD. Amibroker can program to scan the stocks for buy and sell signals.
These are script generated signals. Not all scan results are shown here. The MACD signal should use with price action. Users must understand what MACD and price action are all about before using them. If necessary you should attend a course to learn more on Technical Analysis (TA) and Moving Average Convergence Divergence, MACD.
Once again, the website does not guarantee any results or investment return based on the information and instruction you have read here. It should be used as learning aids only and if you decide to trade real money, all trading decision should be your own.