February 20, 2018
Moses Stock Analysis
^N225 Japan Nikkei 225 Index and 61% Fibonacci Retracement
See chart for more, swing low from September Low, the price action retrace down to 61.8%. Nikkei Index rebounce last week to like many of the US Stock Market Indexes. What will happen this week? Again like US indexes? Will see.
This is a difficult time, can be difficult to trade at time. Manage your risk!
Besides that with some of the countries are enjoying long holiday, many of the traders are out of town.
Powerful Chart Software – AmiBroker
The following chart is produced using AmiBroker charting software. It is a powerful chart software. You plot the stocks you are interested all in one chart, as long as you still could read them. See chart below.
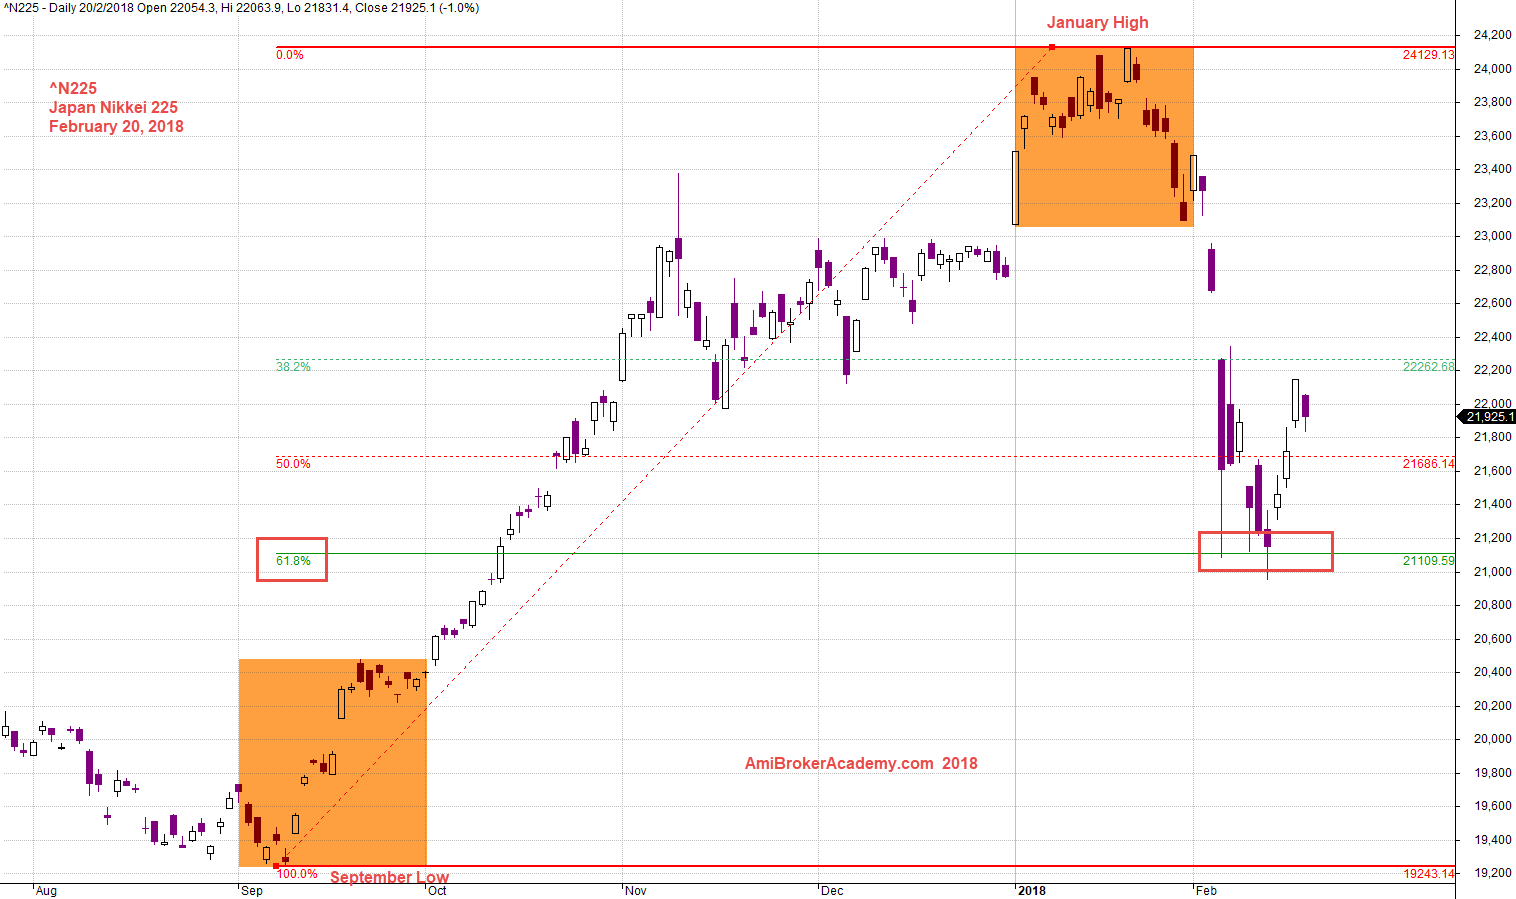
February 20, 2018 Japan Nikkei 225 and Fibo Retracement
^N225 and MACD
See chart for more, see MACD signals.
Manage your risk.
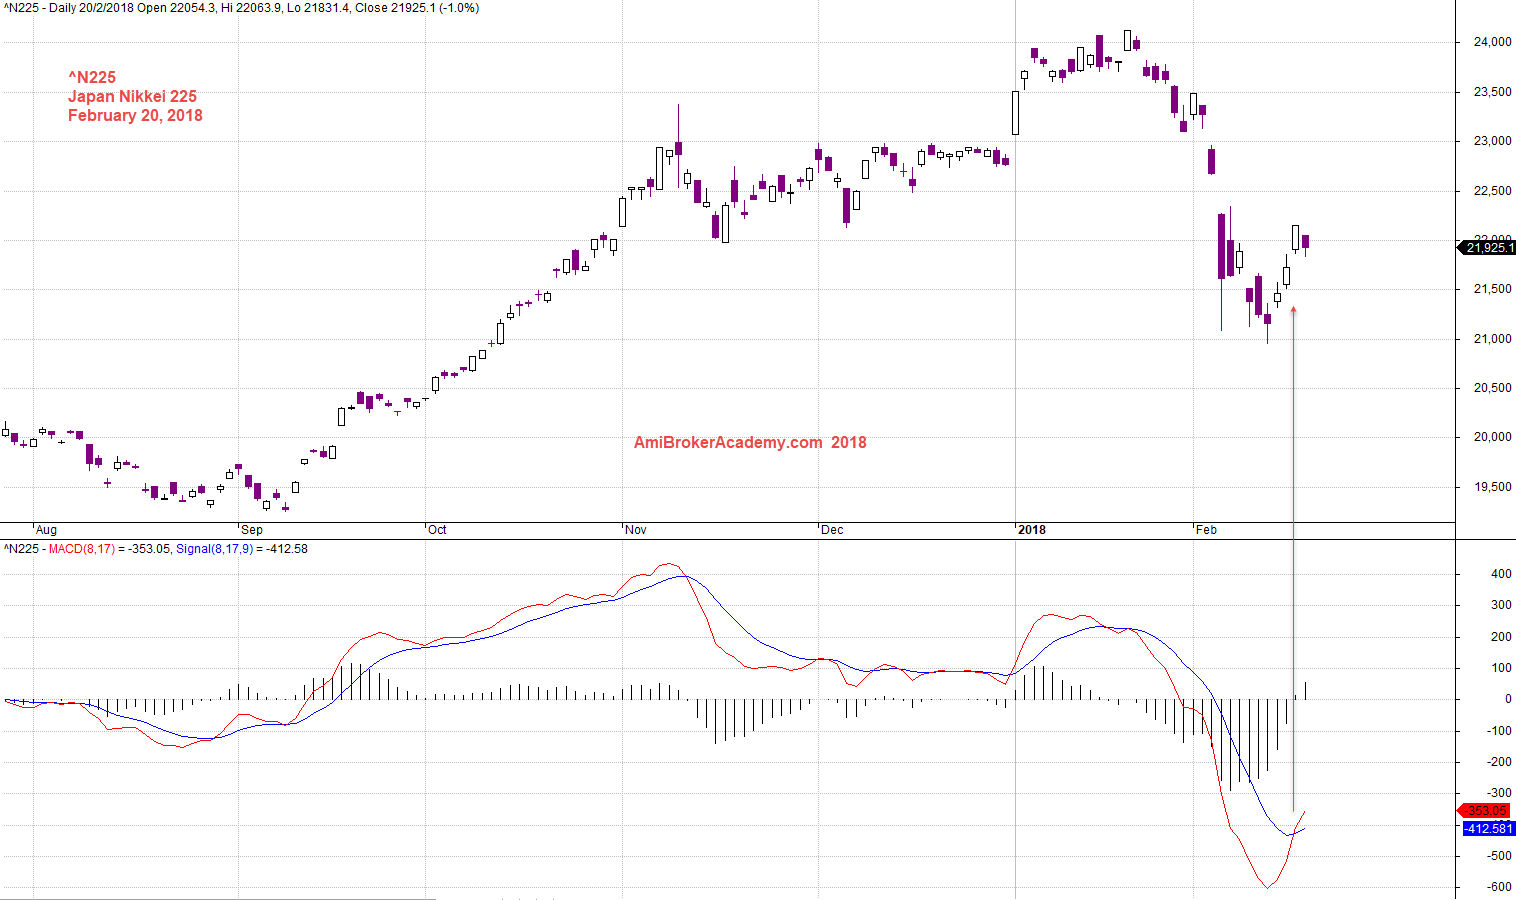
20180220 Japan Nikkei 225 and MACD
Moses
AmiBrokerAcademy.com
Disclaimer
The above result is for illustration purpose. It is not meant to be used for buy or sell decision. We do not recommend any particular stocks. If particular stocks of such are mentioned, they are meant as demonstration of Amibroker as a powerful charting software and MACD. Amibroker can program to scan the stocks for buy and sell signals.
These are script generated signals. Not all scan results are shown here. The MACD signal should use with price action. Users must understand what MACD and price action are all about before using them. If necessary you should attend a course to learn more on Technical Analysis (TA) and Moving Average Convergence Divergence, MACD.
Once again, the website does not guarantee any results or investment return based on the information and instruction you have read here. It should be used as learning aids only and if you decide to trade real money, all trading decision should be your own.