September 2, 2017
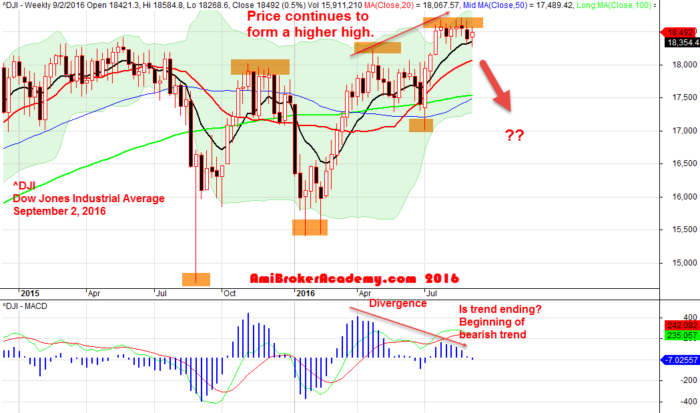
September 2, 2016 Dow Jones Industrial Average Weekly with MACD indicator
Do You Remember? Or Have You Seen These Posting?
Was google (search) to see some of the past ^DJI posting. Realize that many of our analysis is ready something. In fact, we have always remind the readers, all setup can fail. This is the fail example.
And I trust many probably missed these posting.
Many of the analysis, when now look back. We just wonder how we dare to make such comment.
However, whatever we read the chart are using what we learn from the teacher on the technical analysis. Have fun!
Remember, there is no holy grail (the cup or platter used by Christ at the Last Supper) in trading. Sorry, I should not say no. It is very hard to find such as time has past. In trading, we have to agree there is up and down, the market just move according to majority of the traders believe, good stocks, bad stocks. Sometime just no reason lah (Singlish – Singapore English)!
Remember, all setup can fail.
There is no right no wrong, and all set up can fail.
Here, we just want to show you some of the fail setup.
See the following past posting for illustration. But, but depending what type of trader you are, see the chart below, you will understand what we mean.
Example on Fail Setup – Dow -Weekly Chart
If you are long term trader, hold the trade for years. The following setup fail.
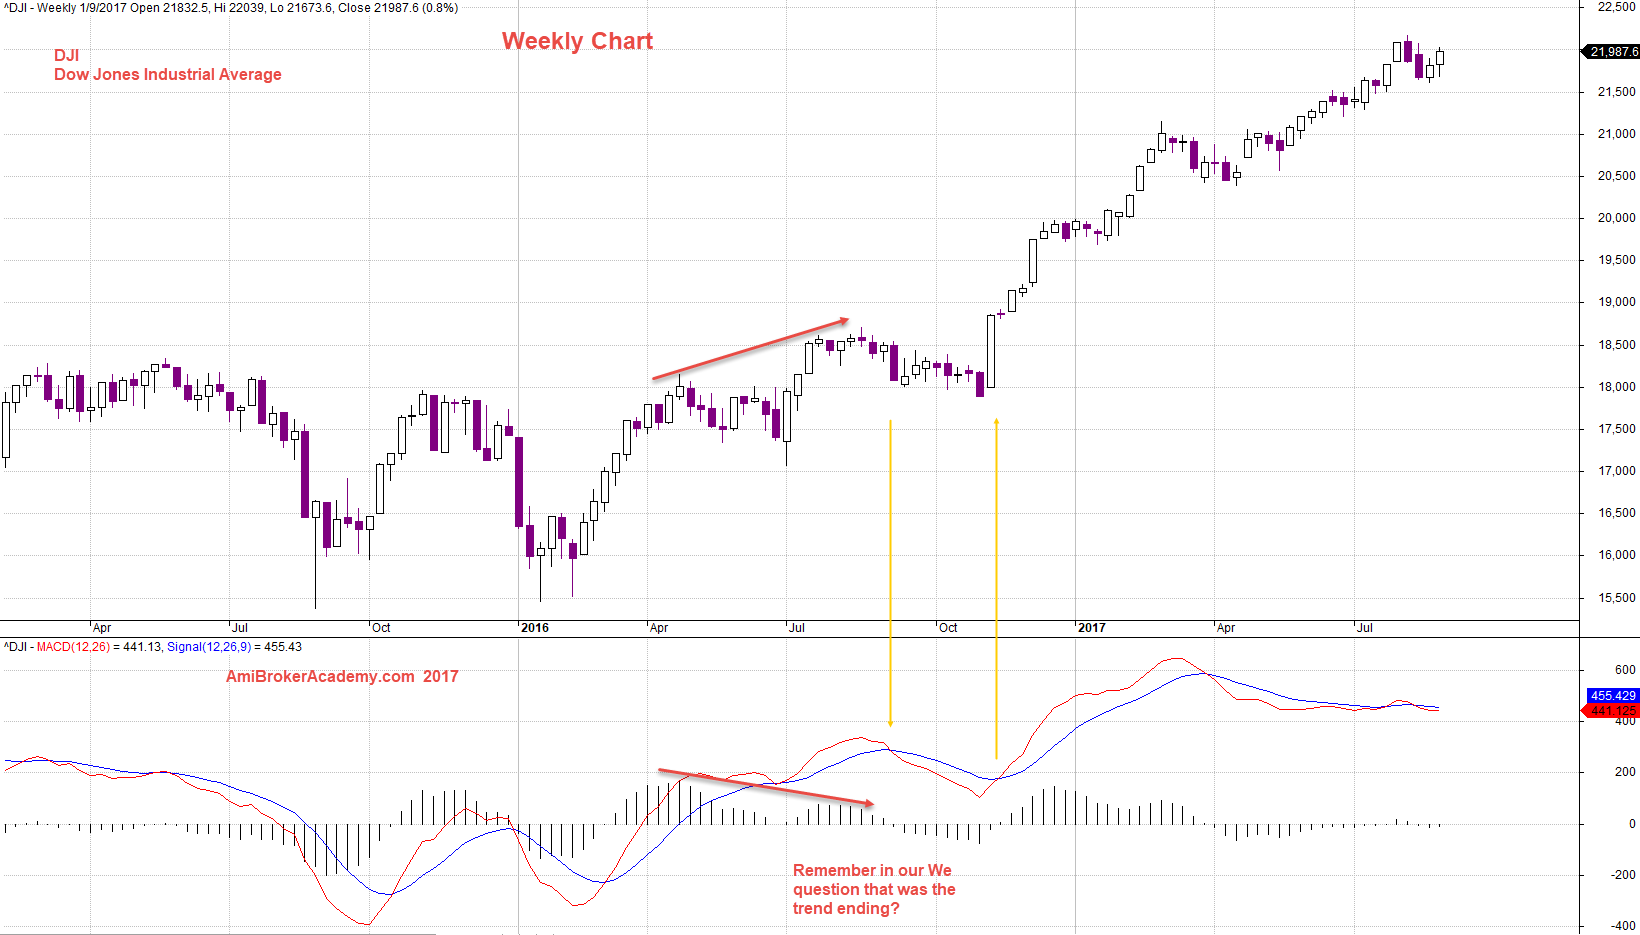
Dow Jones Industrial Average Weekly Setup Fail
Example on Not Fail Setup in Nearer Term – Dow -Daily Chart
If you are long term trader, but not hold the trade for years and only for weeks. The following setup not fail.
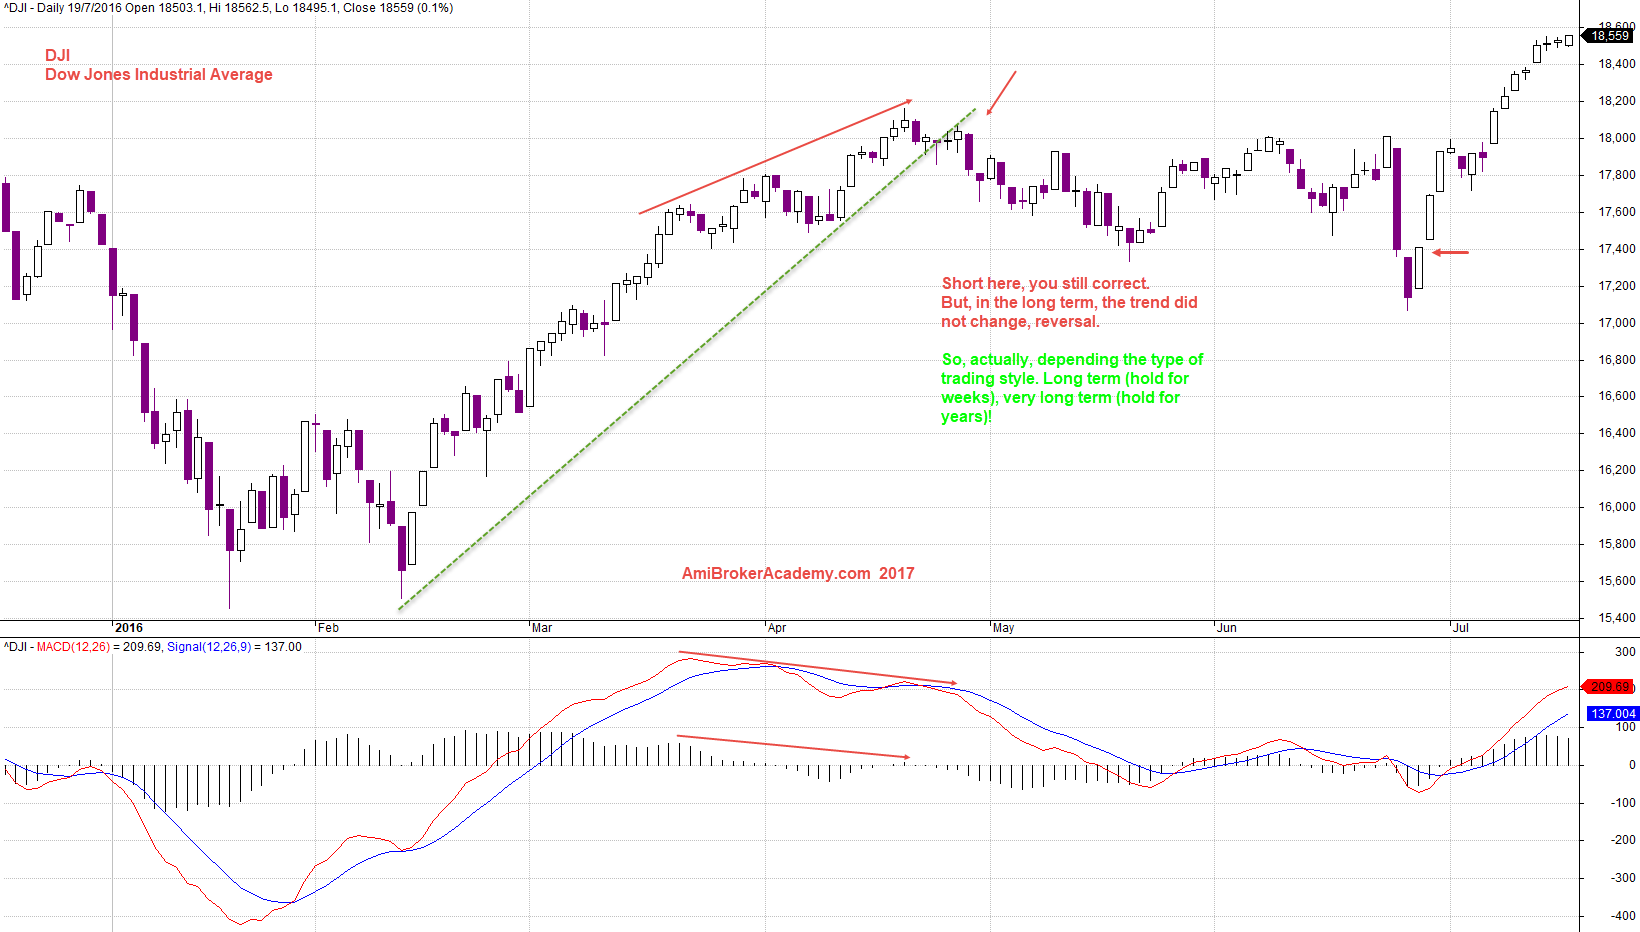
MACD Signals and Dow
Moses
AmiBrokerAcademy.com
Disclaimer
The above result is for illustration purpose. It is not meant to be used for buy or sell decision. We do not recommend any particular stocks. If particular stocks of such are mentioned, they are meant as demonstration of Amibroker as a powerful charting software and MACD. Amibroker can program to scan the stocks for buy and sell signals.
These are script generated signals. Not all scan results are shown here. The MACD signal should use with price action. Users must understand what MACD and price action are all about before using them. If necessary you should attend a course to learn more on Technical Analysis (TA) and Moving Average Convergence Divergence, MACD.
Once again, the website does not guarantee any results or investment return based on the information and instruction you have read here. It should be used as learning aids only and if you decide to trade real money, all trading decision should be your own.