March 24, 2018
Who Will Stand to Have Advantage?
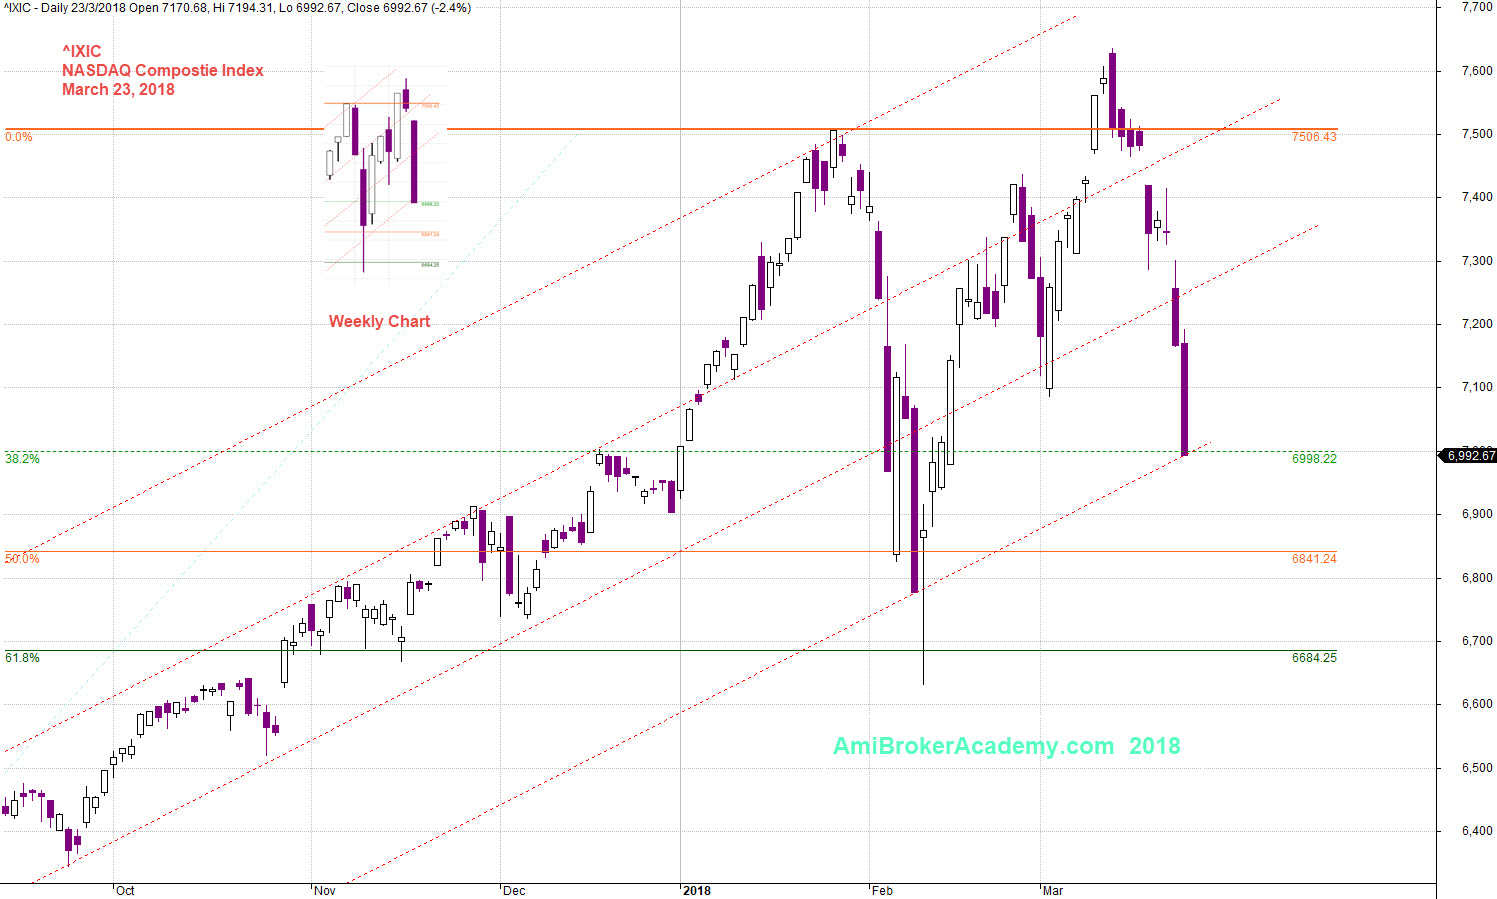
See chart below on NASDAQ composite index, while Dow Jones Industrial Average down 724 points or 2.93% on Thursday. These are all resulting after China retaliated against Donald Trump’s decision to impose tariffs on steel and aluminium, fearing on an all-out trade war between the two world large economies.
US Stock Chart Analysis
^IXIC NASDAQ Composite Index and Channel
Study chart, see NASDAQ Composite Index and Channel. NASDAQ Index forms higher high, but IXIC can not hold up the index and decline. See chart for more. Manage your risk.
Powerful Chart Software – AmiBroker
The following chart is produced using AmiBroker charting software. It is a powerful chart software. Anything, finance ticket you could download from Yahoo! Finance you could plot them, those you are interested all in a chart, so you could analyse them.
20180323 NASDAQ Composite Index Charting
Moses US Stock Chart Analysis
AmiBrokerAcademy.com
Disclaimer
The above result is for illustration purpose. It is not meant to be used for buy or sell decision. We do not recommend any particular stocks. If particular stocks of such are mentioned, they are meant as demonstration of Amibroker as a powerful charting software and MACD. Amibroker can program to scan the stocks for buy and sell signals.
These are script generated signals. Not all scan results are shown here. The MACD signal should use with price action. Users must understand what MACD and price action are all about before using them. If necessary you should attend a course to learn more on Technical Analysis (TA) and Moving Average Convergence Divergence, MACD.
Once again, the website does not guarantee any results or investment return based on the information and instruction you have read here. It should be used as learning aids only and if you decide to trade real money, all trading decision should be your own.